
")


Yesterday the CPI figure for September in the United States rose again to 5.4% from 5.3% that was seen in the previous month, while the core consumer price index data remained at 4%.
These figures are still too high to expect a decrease in the price tension or if it's a transitory phenomenon as the Federal Reserve has been maintaining. more so if the CPI experiences a rise of one-tenth when the hopes were placed on it to decline even slightly.
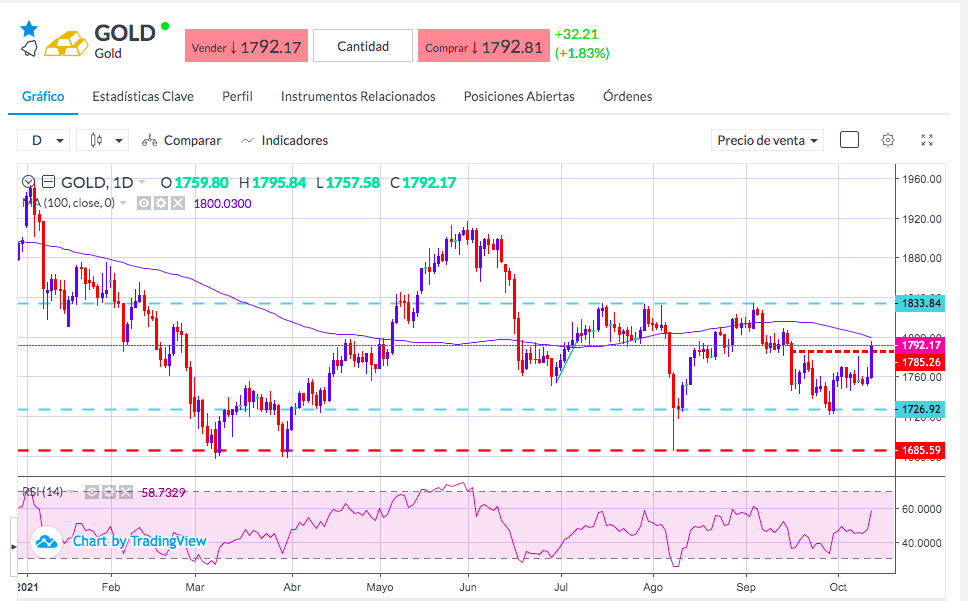
However, the market reaction was confusing and not consistent with the data. The 10-year American bond rose in price after the news, losing around 4 bps. Consequently, the dollar had a downward corrective movement. The GOLD in correlation with these movements rose strongly by 2%, breaking the zone of resistance operating for a month around 1785 and stabilized above 1790.

The strange movement of treasury bonds can be explained by the 30-year auction yesterday, after the 10-year auction the day before, which may have led to demand flows in the market related to these auctions.
Gold was bought strongly but somehow disproportionately since it got a high direct correlation with the price of bonds. The market expects that the rise was accompanied by an extraordinary increase in the volume traded which was above normal and that it could be due to a specific flow without any fundamental reason behind it.
In any case, the unusual performance of the bonds is explained by the text published after Fed's minutes in their last meeting, where a quasi-consensus was mentioned in order to start the process of reducing the tapering program, even quantifying them in a gradual reduction figure of 15 B per month.
Moreover, the minutes reflect the opinion of a large part of the Fed members in regard to the transitory nature of the price increases. According to them, it will disappear in the next year due to supply problems.
Something that evidently contrasts with the published inflation figures.
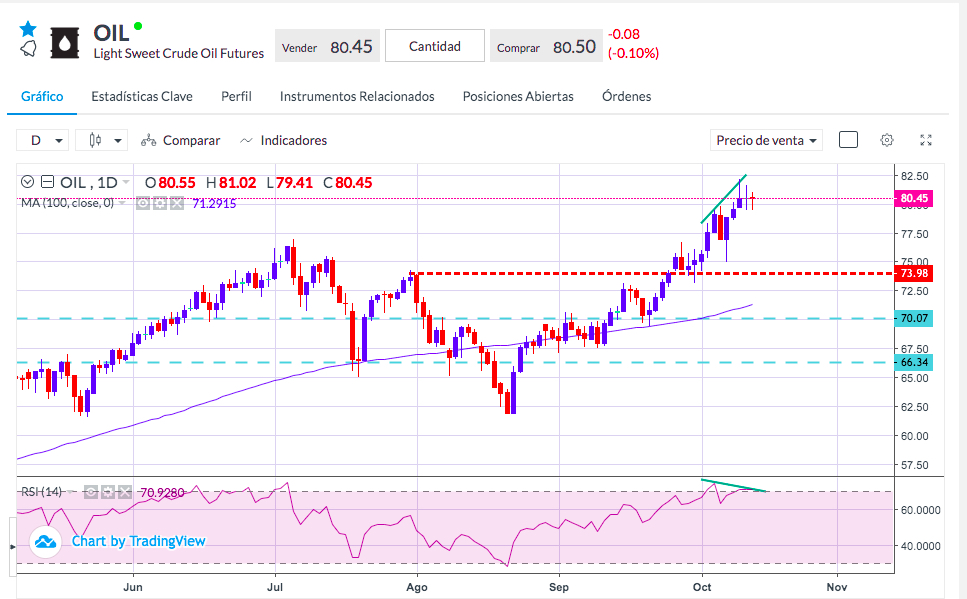
While it is true that the energy market has stopped tightening in the last two days, and oil prices have fallen slightly after reaching the highs at 82.16.
Technically overbought on the daily chart, it begins to form a bearish divergence in the RSI, which would ease the upward pressure of crude.
Sources: Bloomberg, Reuters

