


The Parabolic Stop and Reverse, more commonly known as the Parabolic SAR, is a trend following indicator developed by J. Welles Wilder, trader, and analyst who created the relative strength index (RSI). The parabolic SAR attempts to give traders an edge by highlighting the direction currency pairs, stocks or other assets are moving, as well as providing entry and exit points.
How to use this guide
To get the most out of this guide, it’s recommended to practice putting this Parabolic Sar indicator trading strategy into action. The best risk-free way to test these strategies is with a demo account, which gives you access to our trading platform and $50,000 in virtual funds for you to practice with. Get your free demo account.
Once you’ve found a strategy that consistently delivers positive results, it’s time to upgrade to a fully-funded live account where you can apply your newfound edge.
What is Parabolic Sar
The parabolic SAR is a technical indicator used to determine the price direction of an asset, as well as draw attention to when the price direction is changing. The Parabolic SAR is displayed as a single parabolic line (or dots) underneath the price bars in an uptrend, and above the price bars in a downtrend.
The Parabolic SAR has three primary functions:
- Highlighting the current price direction (trend).
- Providing potential entry signals.
- Providing potential exit signals.
Each of these applications is discussed in further detail below.

Each trend has an end
As we know, each trend is bound to end at some point. As the price movement begins to draw closer to a reversal, the parabolic SAR will reduce its distance to the price action. The smaller the gap between the two is, the closer the moment of a possible price reversal is and penetration becomes more likely.
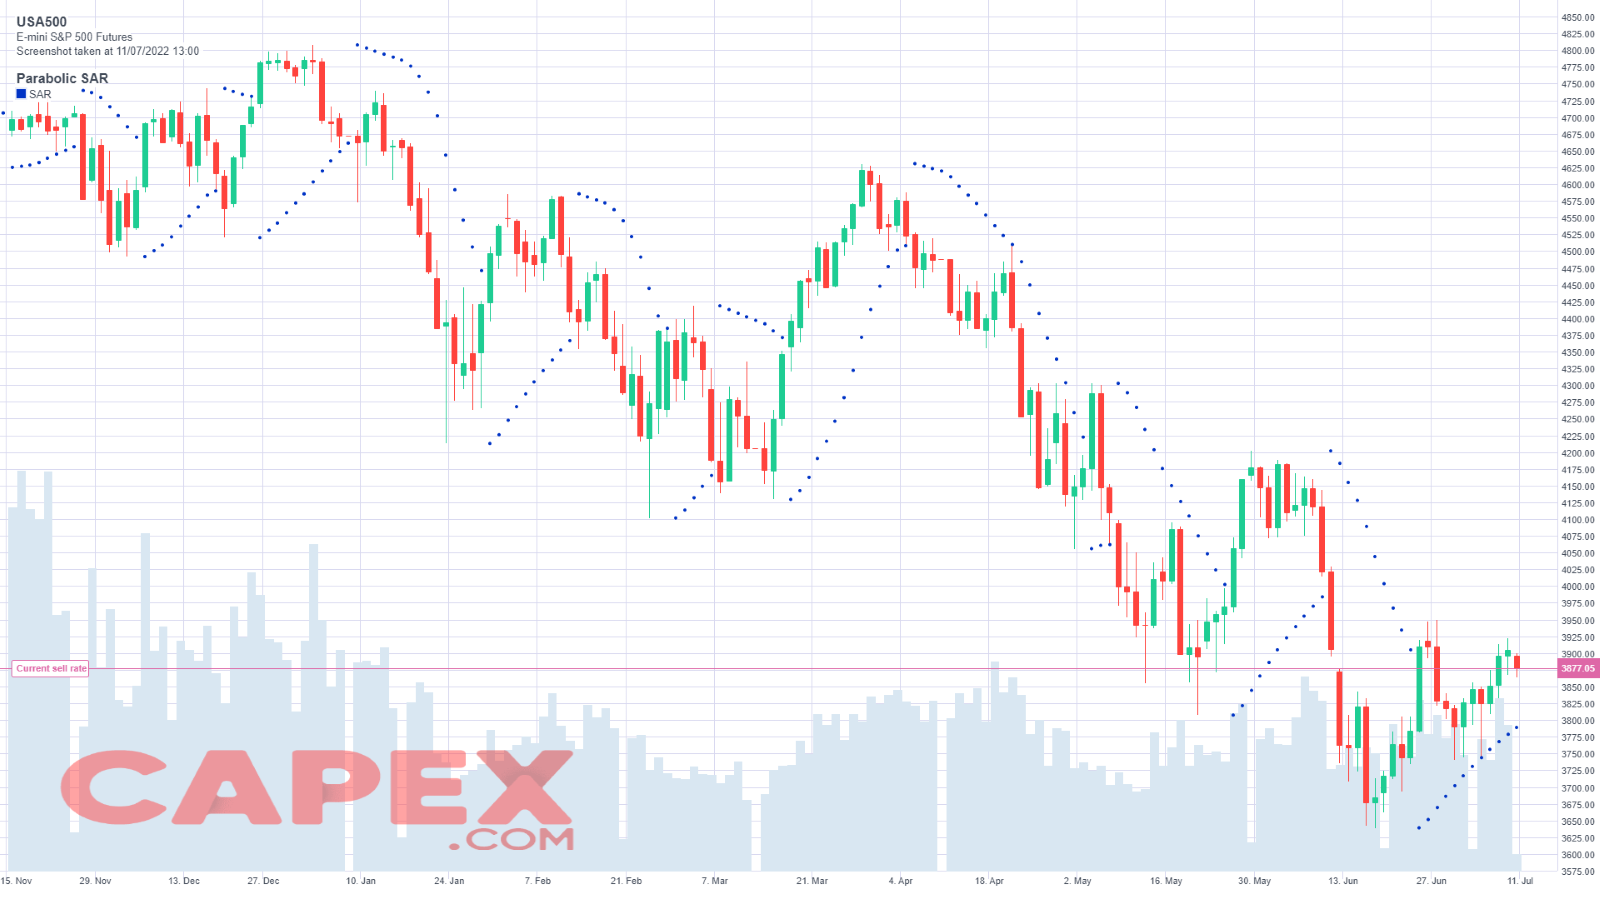
At that point, the dots visualizing the SAR will begin forming on the other side of the price movement, thus signaling that a reversal is occurring. This would be a fine moment to consider closing our long position after you’ve waited for a confirmation. The following USA500 chart presents an uptrend, which comes to an end and collides with the dots beneath it.
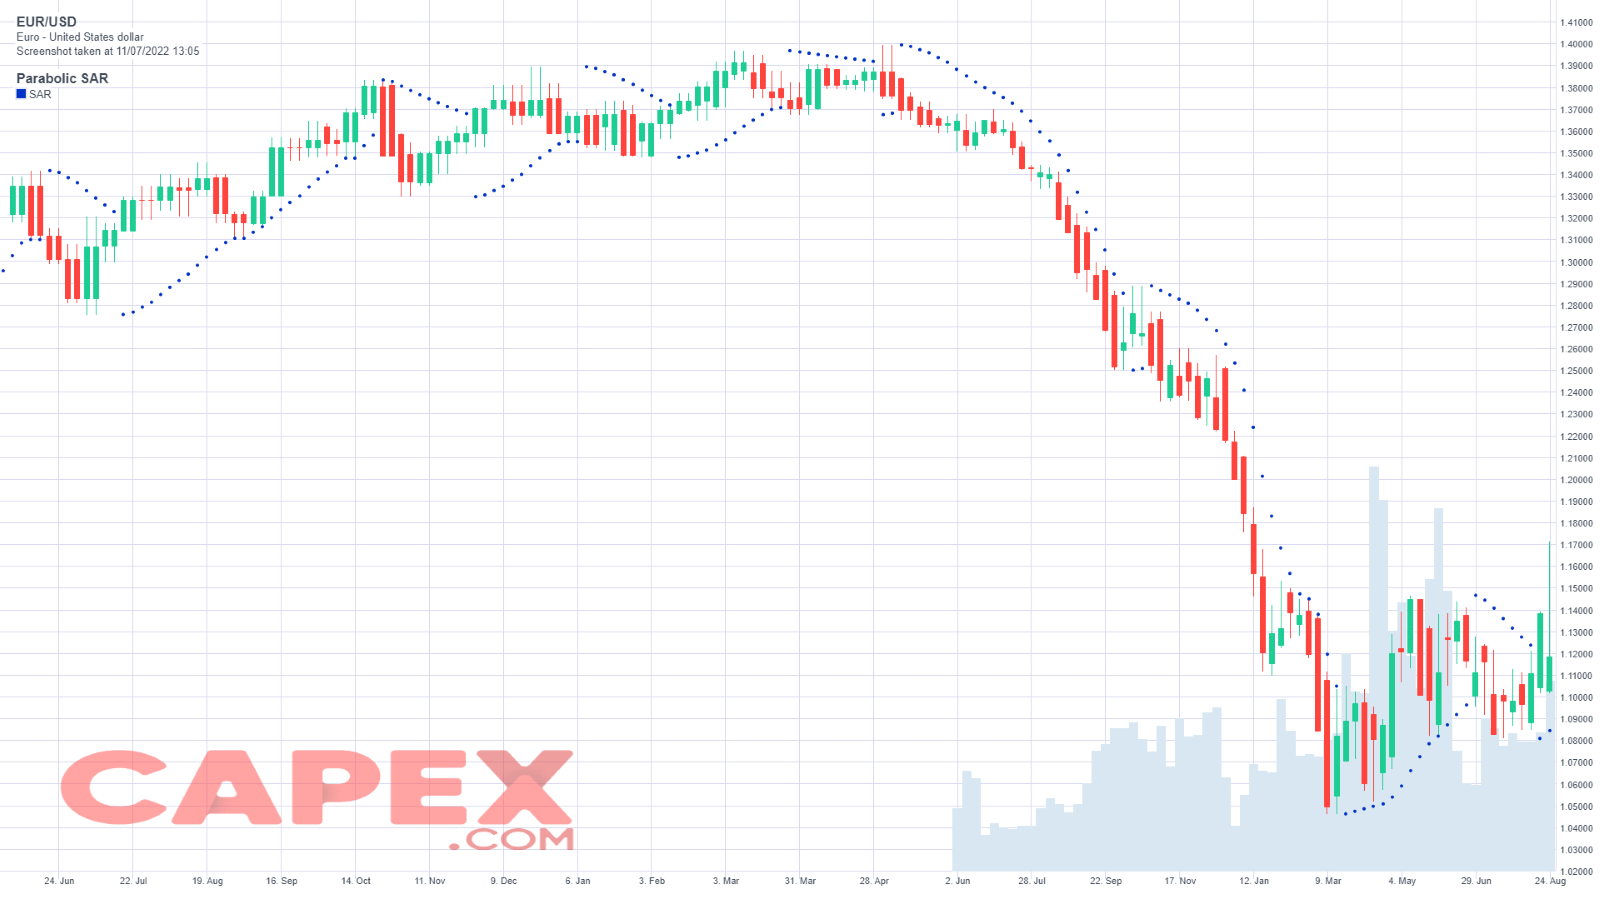
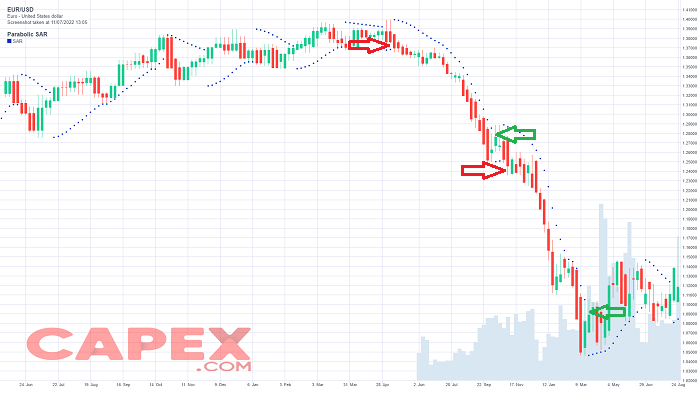
Naturally, the opposite scenario is also true. When the market trends downwards, the SAR is plotted above the price action and as soon as the trend begins to lose momentum, the distance to the indicator gets narrowed and an eventual penetration is likely. This is illustrated in the EURUSD chart below.
Apart from identifying trend reversals and therefore entry and exit points, the parabolic SAR is also helpful for adjusting your trailing stop-loss. The indicator can be used to move the stop loss as each new dot forms, which means that an unexpected price reversal will cause you almost no harm, stopping you out in profit.
Parabolic SAR Formula & Calculation
The Parabolic SAR (PSAR) indicator uses the most recent extreme (highest and lowest) price (EP), along with an acceleration factor (AF), to determine where the indicator dots will appear.
The Parabolic formula is complex with if/then variables that make it difficult to put in a spreadsheet.
These examples will provide a general idea of how SAR is calculated. Because the formulas for rising and falling SAR are different, it is easier to divide the calculation into two parts. The first calculation covers rising SAR and the second covers falling SAR.
The Parabolic SAR is calculated as follows:
- Uptrend: PSAR = Prior PSAR + Prior AF (Prior EP - Prior PSAR)
- Downtrend: PSAR = Prior PSAR - Prior AF (Prior PSAR - Prior EP)
Where:
- EP = Highest high for an uptrend, and lowest low for a downtrend updated each time a new EP is reached.
- AF = Default of 0.02, increasing by 0.02 each time a new EP is reached, with a maximum of 0.20.
What this calculation does is create a dot (which can relate to a line if desired) below the rising price action, or above the falling price action. The dots/lines help highlight the current price direction. The dots are always present, though, which is why the indicator is called a 'stop and reverse'. When the price falls below the rising dots, the dots flip on top of the price bars. When the price rallies through falling dots, the dots flip below the price below.
The Parabolic Sar indicator is available on our online trading platform, WebTrader. Our award-winning platform allows traders to customize technical indicators and tools, add drawing tools to price charts and graphs, and identify chart patterns in order to improve their trading strategy.
How to Trade with the Parabolic SAR
When you see the Parabolic Sar and you want to place a trade, you can do so via derivatives such as CFDs. Derivatives enable you to trade rising as well as declining prices. So, depending on what you think will happen with the asset’s price when one of the Parabolic Sar signals appears, you can open a long position or a short position.
Follow these steps to trade when you see the Parabolic Sar signals:
- Trading any type of technical indicator requires patience and the ability to wait for confirmation. The appearance of one of these Parabolic Sar signals alerts traders of a price reversal, but until that occurs, most traders leave the pattern alone.
- To get started trading with Parabolic Sar, open an account. Choose between a live account to trade CFDs straight away or practise first on our demo account with virtual funds.
- Choose your financial instrument. Parabolic Sar signals can be spotted in most financial markets, especially those that are more volatile, such as forex, cryptocurrencies, and stocks.
- Explore our online trading platform. We offer a wide range of technical indicators that are not limited to Parabolic Sar, as well as providing a range of order execution tools for fast trading, which in turn helps you to manage risk.
The below strategies for trading Parabolic Sar are merely guidance and cannot be relied on for profit.
Parabolic SAR breakout
The parabolic SAR is an indicator that provides constant breakouts. Each time the parabolic SAR flips to the other side of the price, this could be considered a trend reversal or trend break. Therefore, one of the simplest breakout strategies is to wait for a parabolic SAR trade signal to enter in the trending direction following a pullback.
Let’s assume, for example, that the trend is up, and the price is making overall upward progress. Once the parabolic SAR flips on top of the price, this means it is now moving down, entering a pullback. You could consider placing a stop-loss order below the swing low that formed prior to the entry signal with the aim to avoid losses.
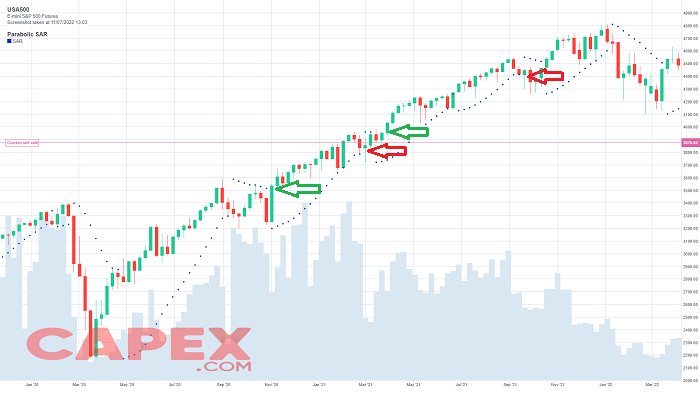
Below is an example using the same USA 500 chart. The price started rising, and the green boxes mark the start and end (and thus the profitability) of each trade that occurred during the uptrend. The current trade is ongoing, but already a small profit is locked in since the trade will be exited if it drops below the indicator. Buy entries occur as the price moves above the dots in the overall uptrend.
The concept is the same for a downtrend. When the price is declining, the parabolic SAR is above the price. When the parabolic SAR drops below the price, this indicates a pullback to the upside. A parabolic SAR breakout strategy works best in assets that are strongly trending. If the price is moving in no apparent direction, then it will seesaw across the parabolic SAR, resulting in multiple unprofitable trades. You should make sure you have the appropriate risk management measures in place.
Double parabolic SAR strategy
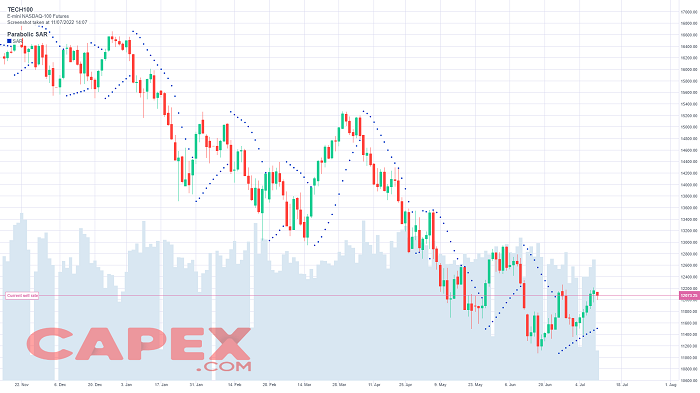
A double parabolic SAR strategy uses two timeframes. First, a longer-term timeframe shows the trend direction based on the direction of the parabolic SAR. Once the long-term trend direction is determined, trades are taken on a shorter timeframe, but only in the direction of the longer-term trend. For example, the daily chart of US Tech 100 with a parabolic SAR attached shows that the price is currently on a downtrend.
Then, when you drop down to the hourly chart (for day trading) or 5 minutes chart (for scalping), and then only take new trade signals in the longer-term direction, the chart below shows the result.
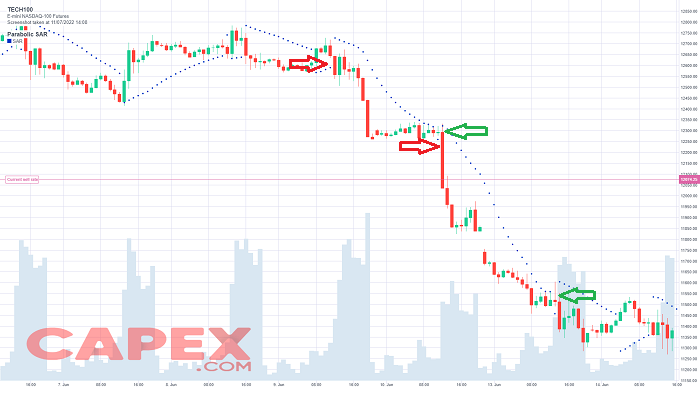
If the downtrend on the daily chart was spotted earlier, then additional trades could well have been made. Not all were profitable, but some were very profitable. This double parabolic SAR strategy is beneficial because it only takes trades in the direction of the longer-term trend, which is more powerful than short-term trends.
Parabolic SAR and stop losses
The parabolic SAR provides several basic functions that include providing trend direction, entry and exit signals, and acting as a trailing stop-loss. These basic functions can be further enhanced into a strategy by adding some additional rules. The breakout strategy requires isolating the overall visual trend direction. The double parabolic SAR strategy makes this approach more systemic by using the indicator direction on a longer-term timeframe as the overall trend direction. This stipulates in which direction to trade on the lower timeframe.
To complete all these strategies, the risk on each trade must be managed, and you should avoid taking a position size that is too large for your account. By using a stop-loss order, you can prevent capital loss if the price does not move in a favorable direction. However, in abnormal market conditions stop orders can be executed at a different price (slippage).
If you wait for a trade signal and candle or price bar to close before entering, then the dots will flip sides and that dot can be used as a stop-loss point. However, sometimes the dot will be far away at the start of a trend, or you may not want to wait for a candlestick to close before taking a trade signal. In these cases, you should consider placing a stop-loss below the recent swing low if going long, or above a recent swing high if going short. Two cents or two pips (percentages in point) above the swing or below the swing low is adequate. This final step makes sure that the risk is controlled, while the parabolic SAR takes care of locking in profit if the price moves favorably.
Pros and Cons of the Parabolic SAR
The main advantage of the indicator is that during a strong trend the indicator will highlight that strong trend, keeping the trader in the trending move. The indicator also gives an exit when there is a move against the trend, which could signal a reversal. Sometimes this ends up being a good exit, as the price does reverse; other times it isn't a great exit because the price immediately begins to move in the trending direction again.
The major drawback of the indicator is that it will provide little analytical insight or good trade signals during sideways market conditions. Because there is no trend present, the indicator will constantly flip-flop above and below the price. This type of price action can last all day, so if a day trader relies solely on the Parabolic SAR for trade signals, in this case, it could be a big losing day.
That is why it is recommended traders learn to identify the trend—through reading price action or with the help of another technical indicator (see Moving Averages, RSI, MACD, ADX, Stochastic) — so that they can avoid trades when a trend isn't.
Final words about Parabolic SAR
The parabolic SAR works the same in forex trading as it does in other markets, such as stock trading, futures trading, or cryptocurrency trading. Any of the strategies discussed above can be applied to the forex market. As mentioned earlier, the indicator works best when there are large price movements.
Summary
The parabolic SAR can be used in several ways in terms of strategies and can be applied to all financial markets. Its most basic functions are the following:
- To find a buy point when the price moves above the dotted line, and the dots move below.
- To find a sell or short point when the price moves below the dotted line, and the dots move above.
- As a trailing stop loss. The parabolic SAR keeps you in a trade until a signal in the opposite direction occurs.
- To indicate whether the price is recently rising or falling, and when a reversal may occur.
Combined with other rules and analysis, the parabolic SAR can form part of a robust trading strategy.
Free trading tools and resources
Remember, you should have some trading experience and knowledge before you decide to trade with indicators. You should consider using the educational resources we offer like CAPEX Academy or a demo trading account. CAPEX Academy has lots of courses for you to choose from, and they all tackle a different financial concept or process – like the basics of analyses – to help you to become a better trader.
Our demo account is a great place for you to learn more about leveraged trading, and you’ll be able to get an intimate understanding of how CFDs work – as well as what it’s like to trade with leverage – before risking real capital. For this reason, a demo account with us is a great tool for investors who are looking to make a transition to leveraged trading.

