


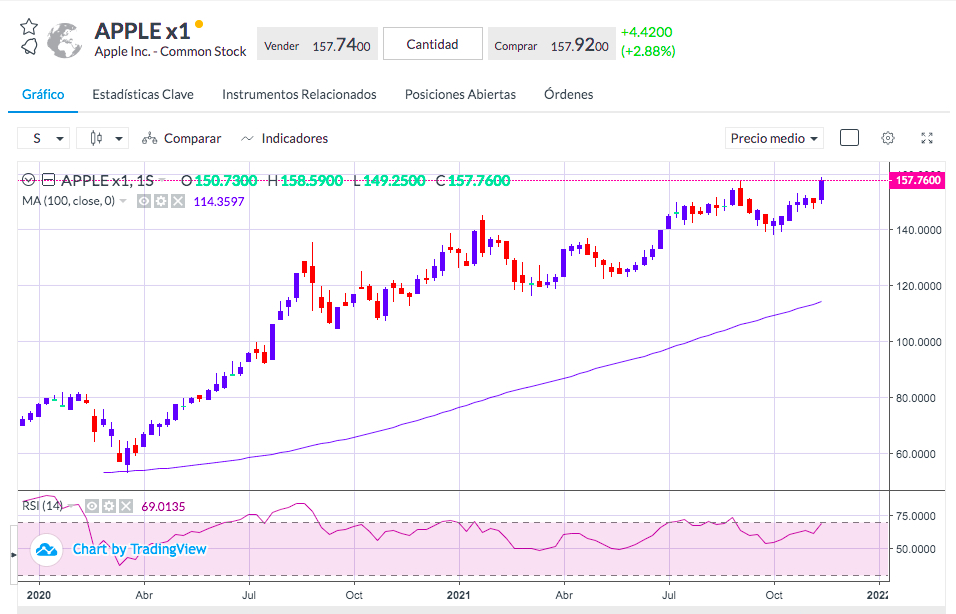
The only highlights were the rises experienced by the S&P500 indices and especially the Nasdaq, which returned to the zone of maximums driven by semiconductor stocks. To the momentum also contributed Apple, which announced that it would enter the electric vehicle market, lifting its stock 3% higher to a new all-time record.

However, the Dow Jones industrial index was losing steam, and after the fall experienced the previous day, it closed the Wednesday trading session unchanged.
The corrections expected by most market analysts do not seem to occur even as the technical analysis indicators continue to show signs of exhaustion of the bullish movement with overbought RSI and with divergences in both daily and weekly charts.
In this sense, next week will be significant because of the Q3 US GDP figures publication, which will give us more clues as to whether the American economy grows or slows down. Despite data being relevant for the performance of stocks related to growth, the market’s focus will also be on the personal consumption expenditure data, which is the benchmark for the Fed to calibrate inflation.
The debate on whether inflation is temporary or permanent is still ongoing. Higher inflation would increase investors’ concerns who fear that the Federal Reserve is not reacting on time and is staying behind the curve.
One of the factors that most affect the generalized price increases is the rise of energy costs. The American government stood by its statements against the surge in oil prices. News surrounding talks between China, Japan, and the United States for joint action to release their strategic oil reserves to the market seems to be pushing down the crude oil price.
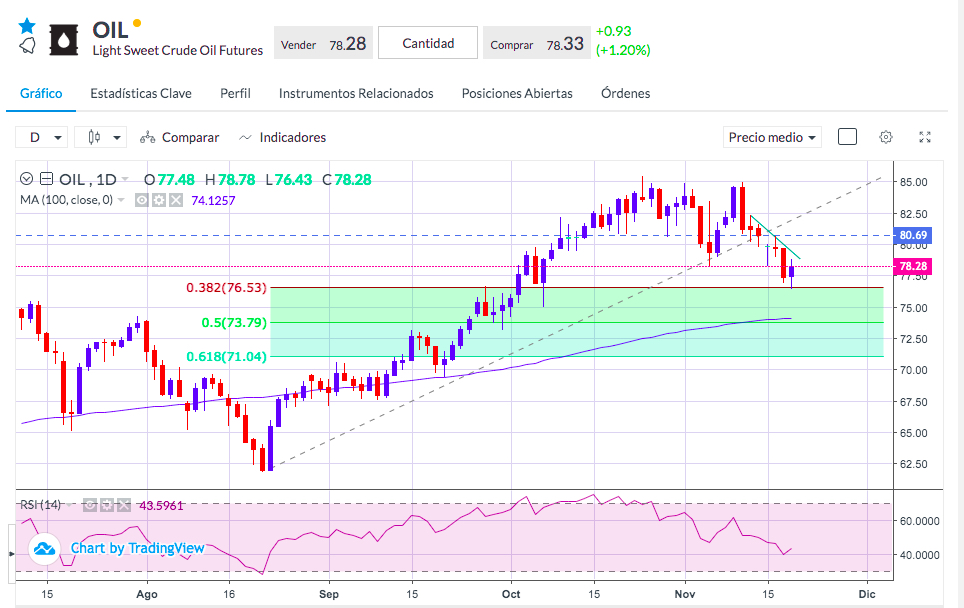
Although yesterday the crude oil experienced an upward correction, technically, it has started a new downward movement. It has led it to touch the 0.382% Fibonacci retracement level at $76.53/barrel, from where it has rebounded during the session. Below this zone, the next level of support is at the 0.50% Fibonacci retracement at $73.70/barrel, where the 100-day SMA line currently runs.
Sources: Bloomberg.com, reuters.com

