


USD/CAD Technical Overview
- Reversal signal on USD/CAD price chart
- Key chart levels and signals to consider
Bears Pullback
On November 9, USD/CAD hit an over two-year low at 1.2926 then rallied as bears seemed to cover. Ultimately, a weekly candlestick closed in the green with a 0.8% gain. Alongside that, the Relative Strength Index (RSI) rose from 35 to 48 signaling a weaker bearish momentum.
USD/CAD Daily Price Chart (July 15 – November 18, 2020)


On November 11, USD/CAD climbed to the current 1.3047 – 1.3152 trading zone. Two days later, the price created a lower high at 1.3171 indicating that bearish momentum was still intact. Nonetheless, the downward trend may reverse due to a bullish price/RSI divergence as the former created a lower low while the latter created a higher low.
A daily close above the high end of the zone ie, above 1.3152 reflects weaker bearish sentiment and may encourage bulls to rally USD/CAD towards 1.3353.
On the flip side, a close below 1.3047 may embolden bears to press the pair even lower towards 1.2914.
Would you like to trade on live oil prices with a regulated broker? Open an account
USD/CAD Four Hour Price Chart (September 4 – November 18, 2020)
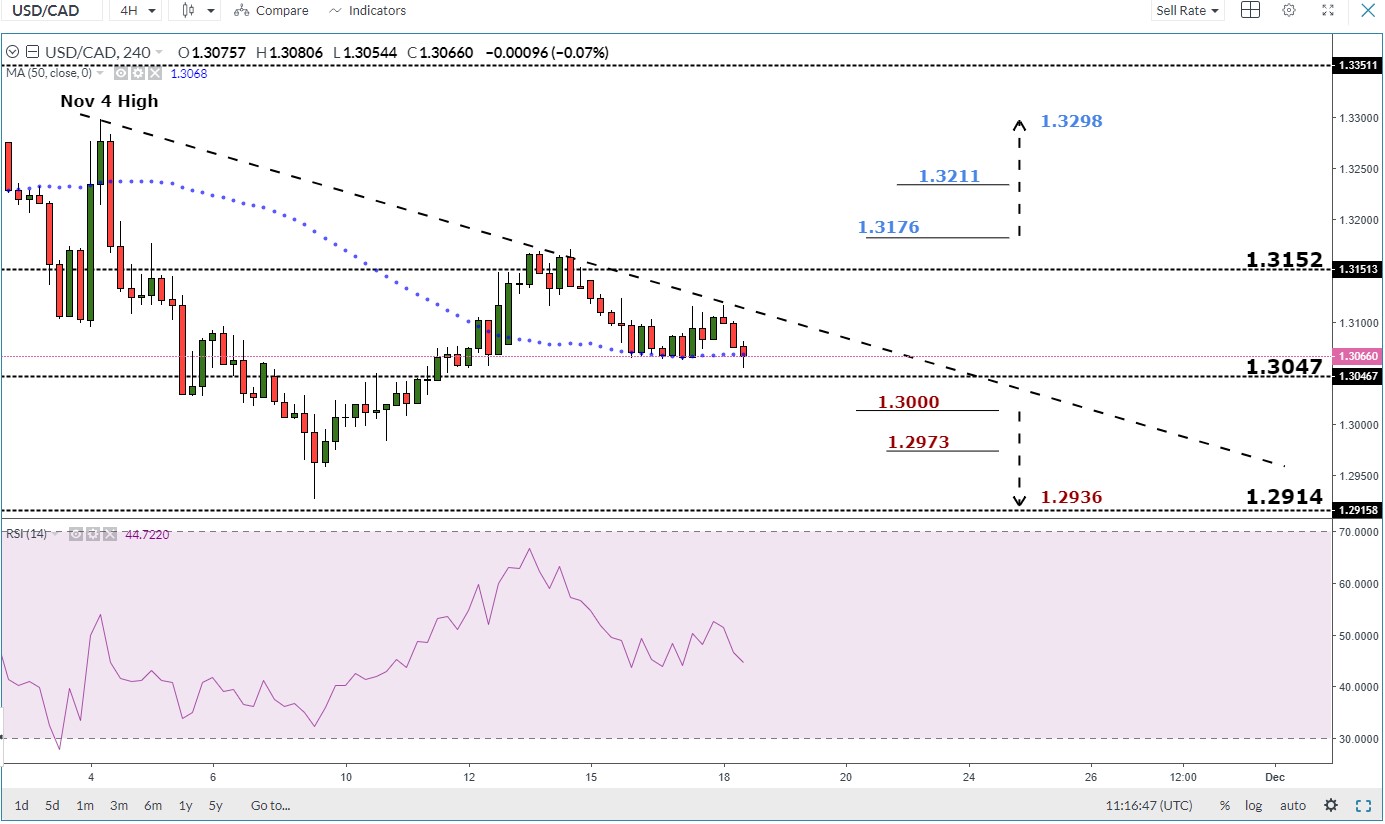
Today, USD/CAD respected the slopping bearish trendline originated from the November 4 high at 1.3298 reflecting that bears were not done.
In conclusion, while the bearish bias is still in place, the bullish divergence discussed above on the daily chart provides a good base for a possible reversal. Therefore, a break above 1.3176 may cause a rally towards the November 4 high at 1.3298. On the other hand, a break below the 1.3000 psychological level could send the price even lower towards 1.2936. As such, the support and resistance levels underlined on the chart should be considered.

