


Euro vs GBP Technical Overview
- EUR/GBP price bears in charge
- Bearish outlook while below 0.9014
EUR/GBP: Bears Pullback
Last week, Euro hit a four-week low against the British Pound at0.8944. However, the price rallied and closed a weekly candlestick modestly in the green with a 0.1 % gain, as some bears seemed to cover.
Alongside that, the Relative Strength Index (RSI) remained below 50 signaling that bearish momentum was still intact.
EUR/GBP Daily Price Chart ( October 14 -November 12, 2020 )

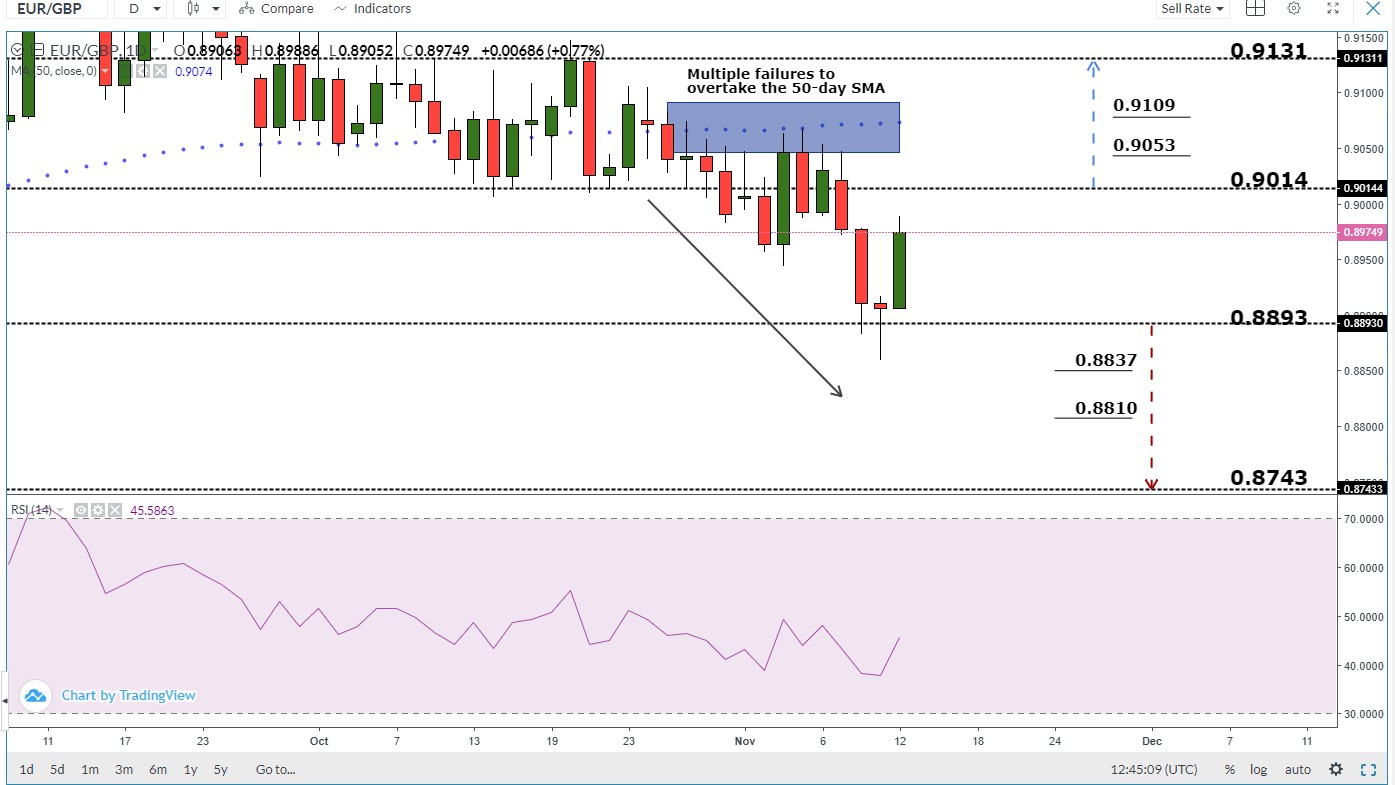
On October 27, EUR/GBP closed below the 50-day SMA and since then the price has failed on multiple occasions to overtake this indicator highlighting that bears were in charge. This week, the price failed twice to close below the low end of the current 0.8893 - 0.9014 and rallied eyeing a test of the high end of the zone.
A daily close above the high end of the zone at 0.9014 could end the bearish sentiment and may send the pair towards the weekly resistance at 0.9131.
While any failure in closing above the high end of the zone could reverse the current move towards the low end of the zone at 0.8893.
EUR/GBP Four Hour Price Chart ( October 26 -November 12, 2020 )
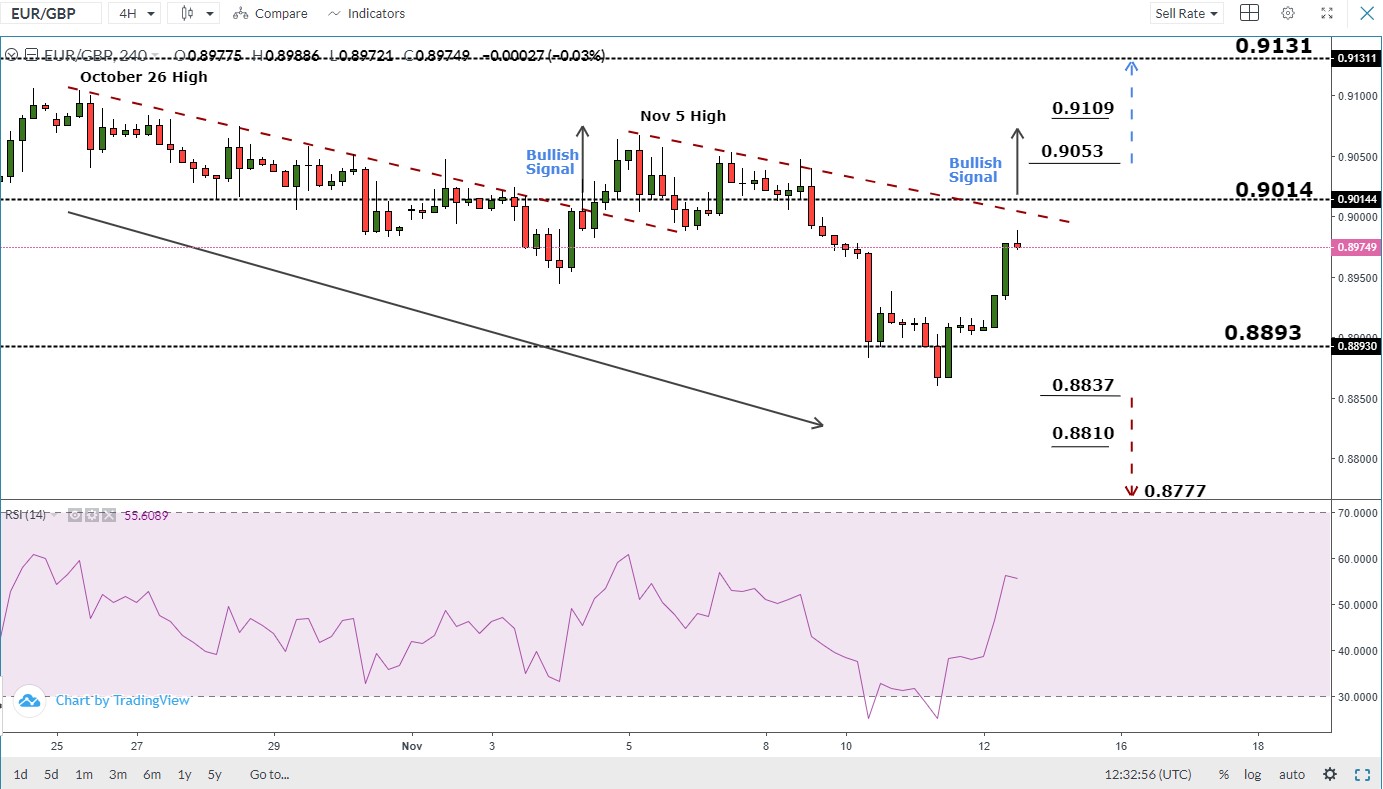
On November 4, EUR/GBP traded above the slopping bearish trendline originated from the October 26 high at 0.9104 and generated a bullish signal. However, the price declined after and started a downtrend move creating higher lows with lower lows.
To conclude, the bearish momentum seems weaker, and break above the downtrend line originating from the November 5 high at 0.9067, could correct the price higher. Therefore, a break above 0.9053 may cause a rally towards 0.9131, while a break below 0.8837 could send EUR/GBP towards 0.8777. As such, the support and resistance levels underlined on the chart should be kept in focus.

