
")


Markets head into the weekend focused on key data releases from Canada, the United States, and China, which may steer global risk sentiment and commodity pricing. Crude oil remains under pressure, weighed by a persistent downtrend and weakening momentum indicators, even as inventories continue to draw down and US demand shows resilience. This mix of technical weakness and supportive fundamentals sets the stage for heightened volatility in the sessions ahead.

Overview
Markets head into the weekend focused on key data releases from Canada, the United States, and China, which may steer global risk sentiment and commodity pricing. Crude oil remains under pressure, weighed by a persistent downtrend and weakening momentum indicators, even as inventories continue to draw down and US demand shows resilience. This mix of technical weakness and supportive fundamentals sets the stage for heightened volatility in the sessions ahead.
Key Economic Events
Friday 15:30 (GMT+3) – Canada: GDP m/m (CAD)
Friday 15:30 (GMT+3) – USA: Core PCE Price Index m/m (USD)
Sunday 04:30 am (GMT+3) – China: Manufacturing PMI (CNY)
Chart Analysis
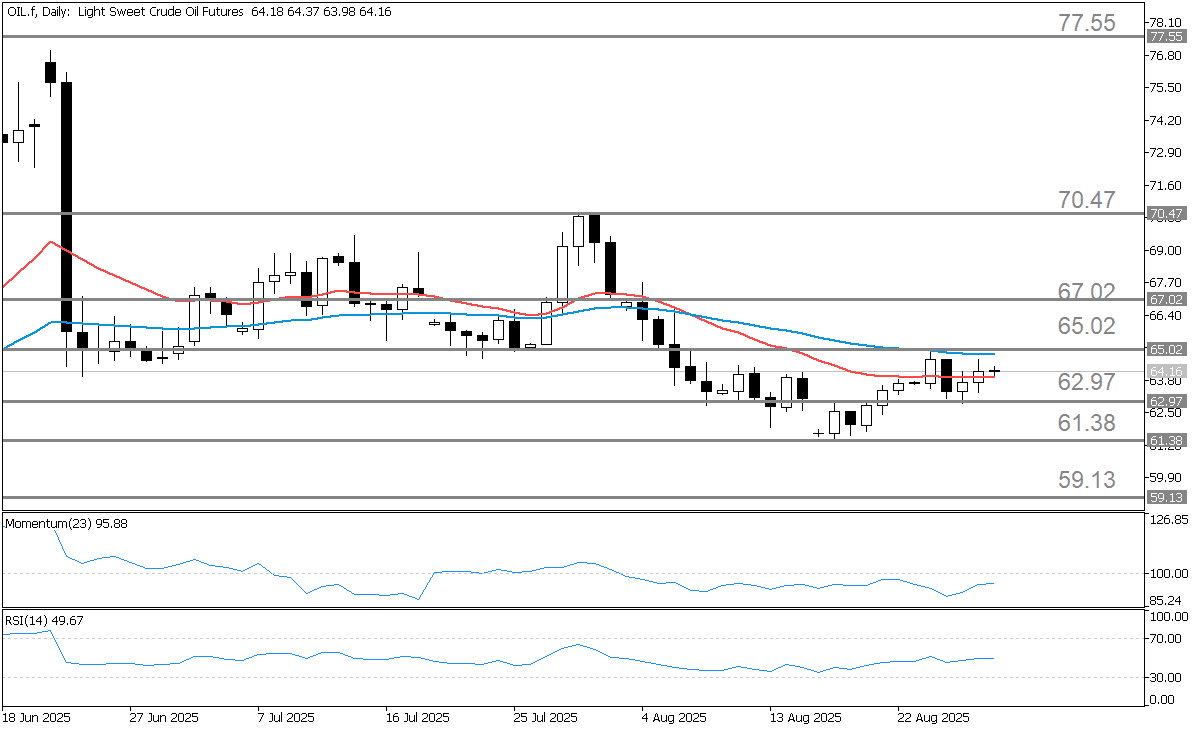
Crude oil has remained under sustained pressure since peaking at $77.55 on June 13, when a long bearish candlestick signaled the onset of a broader decline. Following a brief consolidation, prices broke lower, reinforcing the downtrend. The bearish outlook was confirmed by a "Death Cross," as the 20-period EMA slipped beneath the 50-period EMA.
Momentum indicators remain aligned with this view: the RSI holds below the 50 threshold, while the Momentum Oscillator remains under 100, both consistent with persistent selling pressure. While a recent rebound has lifted prices toward the 23.6% retracement of the peak-to-trough move, the recovery remains limited.
Crude is currently trading above the 20-period EMA, but a decisive break through resistance at $65.02 is required to suggest a shift toward a more constructive trajectory. Until then, the broader bias remains negative.
Key Resistance Levels
Should the buyers take market control, traders may direct their attention toward the four potential resistance levels below:
65.02: The initial resistance level is established at 65.02, which mirrors the high point from August 25.
67.02: The second price target is set at 67.02, representing the weekly resistance, R3, calculated using the standard Pivot Points methodology.
70.47: The third price objective is observed at 70.47, corresponding to the swing high from July 30.
77.55: An additional upside target is projected at 77.55, reflecting the high point reached on June 13.
Key Support Levels
Should the sellers maintain market control, traders may consider the four potential support levels listed below:
62.97: The initial support level is seen at 62.97, corresponding to the weekly Pivot Point, PP, calculated using the standard methodology.
61.38: The second support level is estimated at 61.38, representing the swing low marked on August 18.
59.13: The third support level is identified at 59.13, reflecting the 161.8% Fibonacci Extension drawn from 61.38 to 65.02.
55.49: An additional downside target is 55.49, mirroring the 261.8% Fibonacci Extension drawn from the low point, 61.38, to the high point, 65.02.
Fundamentals
Last week, US refineries processed 16.9 million barrels of oil per day, which was 328,000 barrels less than the week before. They operated at 94.6 percent of their capacity. Gasoline production increased to an average of 10 million barrels per day.
The amount of oil held in storage decreased by 2.4 million barrels and is now about 6 percent below the five-year average. Stored supplies of diesel fuel fell by 1.8 million barrels and are now about 15 percent below average.
Over the last four weeks, overall demand for petroleum products was 21.2 million barrels per day. That is a 2.5 percent increase from the same period last year. Demand for diesel fuel has increased by 7.7 percent.
Conclusion
Crude oil markets remain caught between weakening technical signals and firm underlying demand. While US inventories continue to tighten and product consumption shows resilience, momentum indicators still point to downside pressure unless key resistance levels are reclaimed. With high-impact economic data due from Canada, the US, and China, short-term volatility is likely to intensify, keeping traders focused on both macro drivers and technical levels to gauge the next move.