
")


This week's economic calendar features several high-impact releases that could influence market sentiment and price action across commodities and currencies. US crude oil inventories will headline later today, followed by key updates on Australian employment, UK GDP, and US inflation, retail sales, and consumer sentiment. Together, these data points will offer fresh insight into global growth, demand trends, and potential shifts in monetary policy expectations.

Overview
This week's economic calendar features several high-impact releases that could influence market sentiment and price action across commodities and currencies. US crude oil inventories will headline later today, followed by key updates on Australian employment, UK GDP, and US inflation, retail sales, and consumer sentiment. Together, these data points will offer fresh insight into global growth, demand trends, and potential shifts in monetary policy expectations.
Key Economic Events
Wednesday 17:30 (GMT+3) - USA: Crude Oil Inventories (USD)
Thursday 04:30 am (GMT+3) – Australia: Employment Change (AUD)
Thursday 9:00 am (GMT+3) – UK: GDP m/m (GBP)
Thursday 15:30 (GMT+3) – USA: PPI m/m (USD)
Friday 15:30 (GMT+3) – USA: Retail Sales m/m (USD)
Friday 17:00 (GMT+3) – USA: Prelim UoM Consumer Sentiment (USD)
Chart Analysis
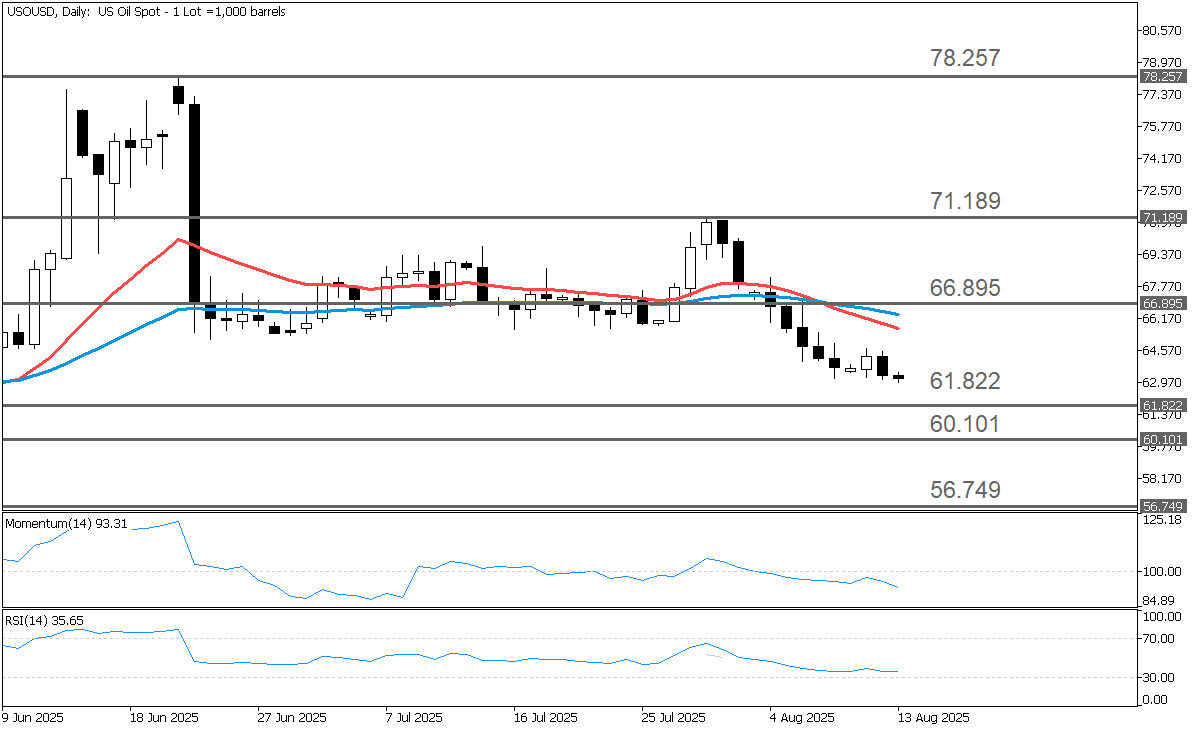
Crude oil has been in a sustained downtrend since July 22, when prices topped at $78.257 per barrel and printed a long bearish candlestick, signaling the start of a decline. This move was followed by a consolidation phase, after which prices broke lower, opening the door for further weakness. The bearish bias is reinforced by a "Death Cross," with the 20-period EMA crossing below the 50-period EMA. Additionally, both the Momentum oscillator and the Relative Strength Index (RSI) remain below their respective 100 and 50 baselines, confirming the negative outlook.
Key Resistance Levels
Should the buyers take market control, traders may direct their attention toward the four potential resistance levels below:
66.895: The initial resistance level is established at 66.895, which mirrors the weekly resistance, R1, estimated using the standard Pivot Points methodology.
71.189: The second price target is set at 71.189, representing the daily high reached on July 30.
78.257: The third price objective is observed at 78.257, corresponding to the swing high from June 22.
80.999: An additional upside target is projected at 80.999, reflecting the high point reached on January 15.
Key Support Levels
Should the sellers maintain market control, traders may consider the four potential support levels listed below:
61.822: The initial support level is seen at 61.822, corresponding to the weekly support, S1, calculated using the standard Pivot Points methodology.
60.101: The second support level is estimated at 60.101, representing the daily low marked on May 30.
56.749: The third support level is identified at 56.749, reflecting the weekly support, S3, estimated using the standard Pivot Points methodology.
55.177: An additional downside target is 55.177, mirroring the lowest price reached in 2025.
Fundamentals
Crude oil prices fell on Tuesday, with September WTI down 1.24%, as the EIA raised its forecast for the 2025 global oil surplus to 1.7 million bpd from 1.1 million bpd, adding to oversupply concerns. Hopes for progress at the upcoming Trump-Putin summit on the Russia-Ukraine conflict also pressured prices on expectations of reduced sanctions on Russian oil.
Additional bearish pressure came from OPEC+'s planned production increases, set to restore 2.2 million bpd by September 2026, and IEA projections of a Q4-2025 surplus equal to 1.5% of global demand.
Supportive factors included a weaker dollar, Trump's postponement of higher tariffs on China, falling US oil rig counts, lower tanker-stored crude, and EIA data showing US crude stocks 6.5% below the five-year average. Longer term, US oil output is projected to decline in 2026 for the first time since 2021 due to reduced shale drilling.
Conclusion
In conclusion, crude oil remains under pressure from growing surplus forecasts, geopolitical developments, and OPEC+ supply plans, with technical indicators pointing to continued downside risk. However, near-term price action could be swayed by this week's heavy data schedule, as updates on inventories, employment, GDP, inflation, and consumption may shift market expectations for global demand and monetary policy. Traders should remain alert for volatility as these events unfold.