


USD/CAD Technical Analysis
- USD/CAD chart reveals a reversal and continuation patterns
- Positive outlook while above 1.3511
Multi-Week High
On September 25, USD/CAD hit an over seven-week high at 1.3416 and retreated after, as some bulls seemed to cut back. Ultimately, a weekly candlestick closed in the green for the third week in a row with a 1.4 % gain. Alongside that, the Relative Strength Index (RSI) rose from 45 to 62 highlighting the start of bullish momentum.
USD/CAD Daily Price Chart (June 1 – September 30, 2020)

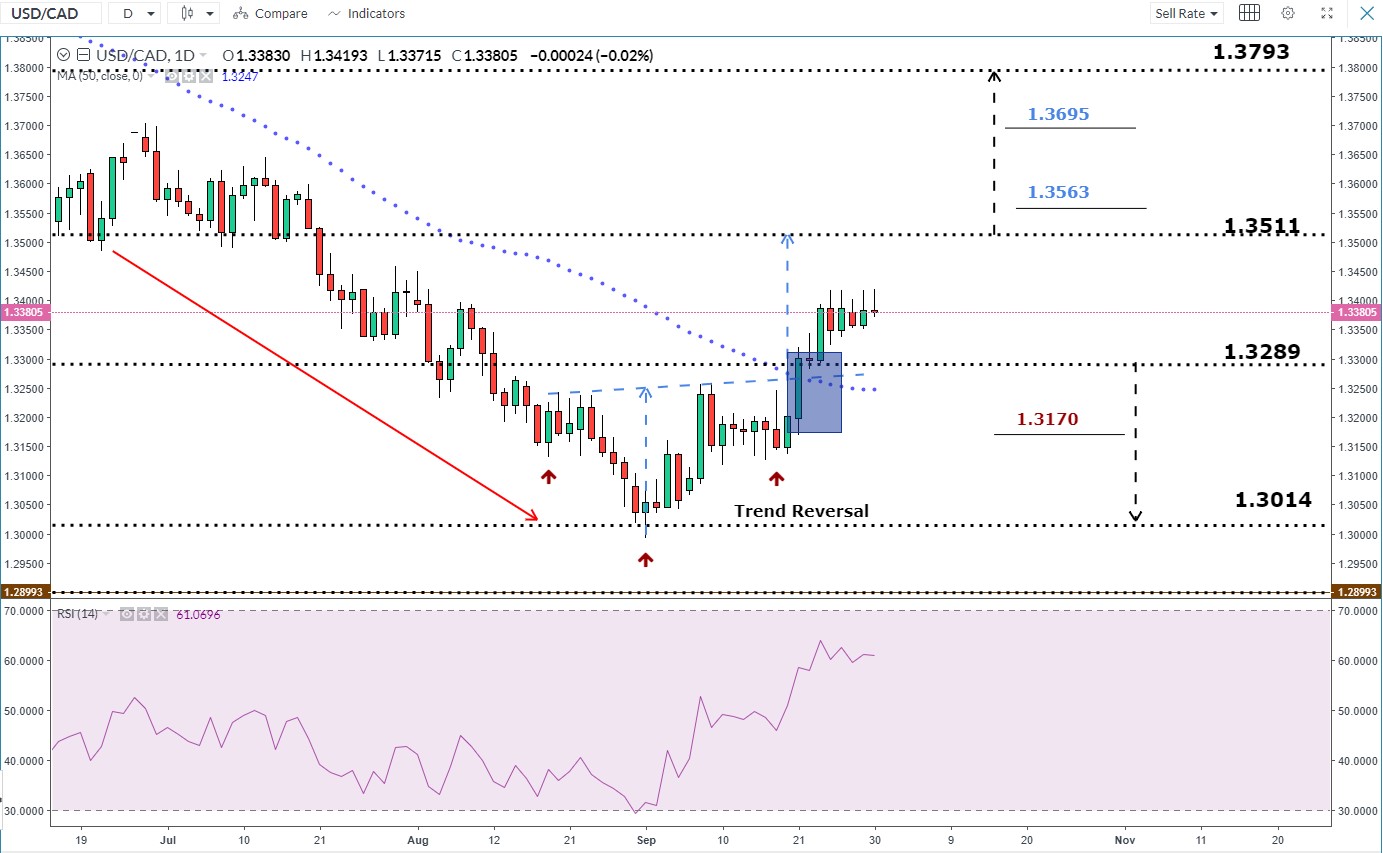
Chart source, Webtrader, Capex.com
On September 21, USD/CAD broke above the inverted head and shoulders pattern at 1.3265. Additionally, the price closed above the 50-day moving average eying a test of the high end of current the current 1.3289 – 1.3511 trading zone.
A daily close above the high end of the zone ie, above 1.3511 could encourage bulls to rally the price towards the monthly resistance level at 1.3793 (May 2017 high).
On the flip side, a failure in closing above the high end of the zone could reverse the pair’s direction towards the low end of the zone ie, 1.3289.
Would you like to trade on live oil prices with a regulated broker? Open an account
USD/CAD Four Hour Price Chart (September 17 – September 30, 2020)

Chart source, Webtrader, Capex.com
On September 24, USD/CAD rebounded from 1.3413 then created higher lows with lower highs and developed this week an ascending triangle.
In conclusion, while bulls have paused the uptrend bias a break above the upper line of the ascending triangle pattern signals a possible continuation of the bullish sentiment. In that scenario, the price may rally for a test of the high end of the current trading zone discussed above on the daily chart. A further break above 1.3563 could send the pair towards 1.3703 while, a break below 1.3270 could send USDCAD even lower towards 1.3170. As such, the support and resistance levels underlined on the chart should be kept in focus.

