

")


The Money Flow Index (MFI) is classified as an oscillator, a term used in technical analysis to describe a tool that creates bands around some mean level. The theory behind the MFI indicator is that when these levels are met, the market price could soon reverse, and traders usually think about opening a position to take advantage of the momentum.
How to use this guide
To get the most out of this guide, it’s recommended to practice putting these Money Flow Index (MFI) strategies into action. The best risk-free way to test these strategies is with a demo account, which gives you access to our trading platform and $10,000 in virtual funds for you to practice with.
Once you’ve found a strategy that consistently delivers positive results, it’s time to upgrade to a fully funded live account where you can apply your newfound edge.
What is Money Flow Index (MFI)
Money Flow Index (MFI) is the technical indicator, which indicates the rate at which money is invested into a security and then withdrawn from it. The Money Flow Index (MFI) uses price and volume data for identifying overbought or oversold signals in an asset. It can also be used to spot divergences which warns of a trend change in price. The oscillator moves between 0 and 100.
Construction and interpretation of the indicator is like Relative Strength Index (RSI) with the only difference that volume is important to MFI.
Analysts found that volume alone was not a clear gauge of momentum – what traders should really be interested in is the market response to price changes. Therefore, the MFI also looks at price movement to confirm whether there is a stronger momentum upwards or downwards, indicating the sentiment of the market.
When analyzing the money flow index one needs to take into consideration the following points:
- divergences between the indicator and price movement. If prices grow while MFI falls (or vice versa), there is a great probability of a price turn;
- Money Flow Index value, which is over 80 or under 20, signals correspondingly of a potential peak or bottom of the market.

Money Flow Index Calculation - Formula for the Money Flow Index (MFI)
The calculation of the Money Flow Index includes several stages. At first one defines the typical price (TP) of the period in question:
- TP = (HIGH + LOW + CLOSE) / 3
Then one calculates the amount of the Money Flow (MF):
- MF = TP * VOLUME
If today’s typical price is larger than yesterday’s TP, then the money flow is considered positive. If today’s typical price is lower than that of yesterday, the money flow is considered negative.
POSITIVE MONEY FLOW is a sum of positive money flows for a selected period of time. NEGATIVE MONEY FLOW is the sum of negative money flows for a selected period of time.
Then one calculates the money ratio (MR) by dividing the positive money flow by the negative money flow:
- MR = POSITIVE MONEY FLOW / NEGATIVE MONEY FLOW
And finally, one calculates the money flow index using the money ratio:
- MFI = 100 - (100 / (1 + MR)
Where:
HIGH — the highest price of the current bar;
LOW — the lowest price of the current bar;
CLOSE — close price of the current bar;
VOLUME — the volume of the current bar.
Why should traders care about the money flow index?
Traders should care about the money flow index, as it can help to identify potential reversals when overbought and oversold signals are shown. It can be a key measure of the market sentiment surrounding an asset, as the MFI can show trader enthusiasm or indifference.
Like other volume-based analysis tools, the MFI is considered a leading indicator, so it can be used to predict market movements. However, it is important to remember that leading indicators are not entirely accurate. So, they should always be used in conjunction with other forms of analysis, and alongside a suitable risk management strategy.
How can you use Money Flow Index in trading
When you see the Money Flow Index signals and you want to place a trade, you can do so via derivatives such as CFDs. Derivatives enable you to trade rising as well as declining prices. So, depending on what you think will happen with the asset’s price when one of the signals appears, you can open a long position or a short position.
Follow these steps to trade when you see the Money Flow Index signals:
- Trading any type of technical indicator requires patience and the ability to wait for confirmation. The appearance of one of these Money Flow Index signals alerts traders of a price reversal.
- To get started trading the Money Flow Index oscillator, open an account. Choose between a live account to trade CFDs straight away or practice first on our demo account with virtual funds.
- Choose your financial instrument. Money Flow Index signals can be spotted in most financial markets, especially those that are more volatile, such as forex, cryptocurrencies, and stocks.
- Explore our online trading platform. We offer a wide range of technical indicators that are not limited to the Money Flow Index, as well as providing a range of order execution tools for fast trading, which in turn helps you to manage risk.
The below strategies for trading Money Flow Index signals are merely guidance and cannot be relied on for profit.
1. Overbought/Oversold condition
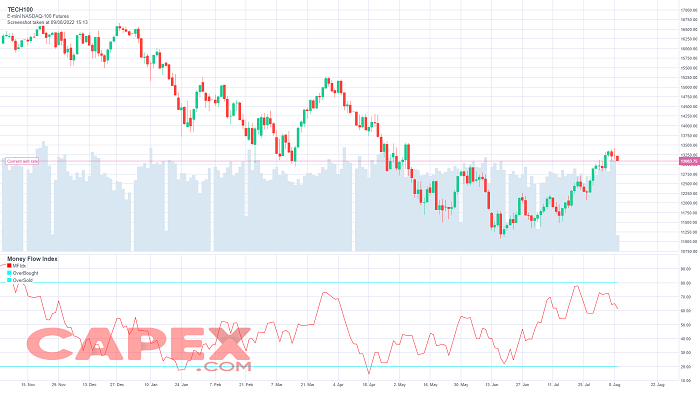
Security will be considered overbought if the MFI shows a fast price rise to a high level. Similarly, a security is considered oversold if the MFI indicates a rapid decline in the price to a considerably low level. The oversold and overbought levels are helpful in the identification of price extremes.
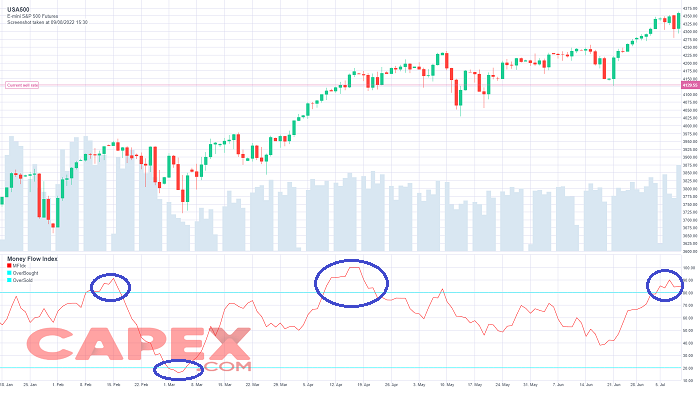
Generally, overbought conditions occur if the MFI is above 80, and below 20 MFI indicates oversold conditions. The prices may continue to rise while the upward trend is strong, and the MFI can increase beyond 80.
On the other hand, MFI can drop below 20 when the prices continue to fall in the presence of a strong downward trend. If the MFI increases above 90, it is considered a truly overbought condition, and a below 10 MFI is considered a truly oversold condition.
However, the MFI beyond 90 and less than 10 occur rarely and suggest that a price movement is not sustainable. Many securities trade in the exchange market without reaching the price extremes of the 90/10 level.
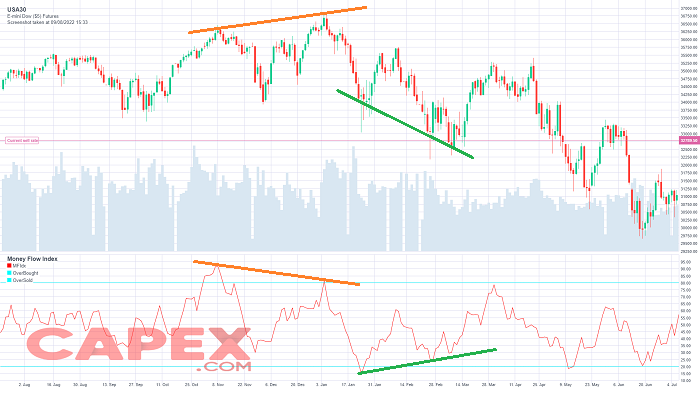
2. Divergences
Divergence signals occur if the indications from the price action and the MFI are the opposite. The difference in the indications can be regarded as an upcoming reversal. Specifically, there are two types of divergences:
Bullish MFI divergence
It occurs when the price changes to a new low, whereas the MFI, indicates a higher low showing a boost in money flow. It implies that the selling pressure is decreasing, and buyers will be taking over the market. It presents an opportunity of buying securities at low prices.
Bearish MFI divergence
It occurs when the price shifts to a new high while the MFI indicates a lower high. It signifies the decrease in buying pressure and the time for sellers to take over the market. It is an opportunity for sellers to make profits.
3. Failure swings
Like divergences, failure swings can also result in a reversal in price. However, failure swings do not depend on price and completely rely on the MFI. There are four steps in failure swings in both types of failure swings – bullish and bearish.
Bullish MFI failure swing
Step 1: MFI decreases below 20 (oversold)
Step 2: MFI recovers and rises above 20
Step 3: MFI decreases but stays above 20
Step 4: MFI shoots above the previous highBearish MFI failure swing
Step 1: MFI increases above 80 (overbought)
Step 2: MFI drops below 80
Step 3: MFI slightly increases but stays below 80
Step 4: MFI drops below the previous low
Limitations of the Money Flow Index
The MFI can produce false signals. This is when the indicator does something that indicates a good trading opportunity is present, but then the price doesn't move as expected resulting in a losing trade. A divergence may not result in a price reversal, for instance.
The indicator may also fail to warn of something important. For example, while a divergence may result in a price reversing some of the time, divergence won't be present for all price reversals. Because of this, it is recommended that traders use other forms of analysis and risk control and not rely exclusively on one indicator.
Money flow index vs relative strength index
The relative strength index (RSI) is another technical oscillator, which is used to chart the strength or weakness of price movements based on the closing prices of a recent trading period. Both the RSI and MFI provide overbought and oversold signals, which can be used by traders to open and close positions.
Where the two technical analysis tools differ is that the RSI does not incorporate volume data. This is why the MFI is often known as the volume-weighted RSI. The MFI is often thought to provide earlier signals than the RSI as it is a leading indicator. However, there is no consensus as to whether one is better than the other – in fact, many traders will use them both to confirm any price signals.
The Money Flow Index Summed Up
- Money Flow Index (MFI) is an indicator that measures the selling and buying pressure by analyzing price and volume data.
- The MFI indicator swings between 0 and 100.
- The overbought condition occurs when the MFI rises above 80. An MFI below 20 indicates an oversold condition.
- A divergence between the indicator and price is noteworthy. For example, if the indicator is rising while the price is falling or flat, the price could start rising.
Free trading tools and resources
Remember, you should have some trading experience and knowledge before you decide to trade technical indicators. You should consider using the educational resources we offer like CAPEX Academy or a demo trading account. CAPEX Academy has lots of free trading courses for you to choose from, and they all tackle a different financial concept or process – like the basics of analyses – to help you to become a better trader.
Our demo account is a great place for you to learn more about leveraged trading, and you’ll be able to get an intimate understanding of how CFDs work – as well as what it’s like to trade with leverage – before risking real capital. For this reason, a demo account with us is a great tool for investors who are looking to make a transition to leveraged trading.