


You might be interested in stock trading if you want to speculate on the price movement without owning the asset and to leverage your position. Discover how to trade stocks with our guide.
Stock trading can be complex, involving a variety of components and requiring knowledge. If you do have the money and want to learn to trade, online brokerages have made it possible to trade stocks quickly from your computer or smartphone.
How to Trade Stocks – Quick Guide
- Create a live trading account. Open a live account to trade CFDs on stock market price movements without owning the underlying asset. With CAPEX.com you can trade CFDs on up to 2,000 stocks with tight spreads.
- Research and pick your stocks. Visit our market analysis section, which is filled with market outlooks, forecasts, and price predictions. Also, our integrated third-party tools like Tip Ranks or Trading Central can help you to analyse a company’s fundamentals.
- Determine the direction of your trade. Based on your research, decide if you wish to go long and ‘buy’ the stock or go short and ‘sell’. This is a matter of speculating whether the price of the stock will rise, or fall based on your research. In the case of short selling, beware of a short squeeze in the stock market.
- Choose a trading strategy. Once you know which share you are trading on and the direction of that trade, you can determine your entry and exit points based upon your trading plan. Make sure you don’t forget to implement your risk management guidelines as part of your trading plan.
- Determine your position size, then ‘buy’ or ‘sell’ the stock. If the trade aligns with your trading plan, open an order ticket to speculate on the asset’s price action. Make sure to place stop-loss and take-profit orders to manage the risk of your position size.
- Monitor and close your position. Keep an eye on your trade and close it as stated in your trading plan. That is, if it has not already been closed by the risk management conditions that you previously set.
For more info about how to trade stocks, you can discover everything you need to know in this guide.
What is the stock market?
A stock market, often known as an exchange, is a type of financial market where equities of companies are purchased and sold. Comparing the stock market to other markets, like the foreign exchange or currency market, a stock market is typically more organised and controlled. Additionally, rather than being set by a broker or market maker, the prices of stocks and shares on exchanges are determined by the natural forces of supply and demand.
There are stock markets in major cities all around the world. Several typical transactions include:
- NYSE (New York Stock Exchange)
- NASDAQ (National Association of Securities Dealers Automated Quotations System)
- LSE (London Stock Exchange)
- Euronext (Paris, Brussels, Amsterdam, Milan, Dublin, Lisbon, Oslo)
- Duetsche Borse (Frankfurt Stock Exchange)
- JPX (Japanese Exchange Group)
- Saudi Stock Exchange (Tadawul)
- Shanghai Stock Exchange (Shanghai)
- BVB (Bucharest Stock Exchange)
How the stock market works
A stock market brings together buyers and sellers on one platform and enables them to negotiate prices and transfer ownership of stocks and shares. If a company is public, its stocks are freely traded on the stock market and the price is determined by supply and demand from investors. Stock traders aim to buy stocks at a low price with the hope that the share price will rise in the future so they can cash out on the price increases. However, it can be just as common for investors to lose money if the stock price falls.
Companies use a procedure known as an IPO (initial public offering) to list their shares for the first time. In this case, a business's shares are put up for sale as it becomes a public company. When investors purchase IPO stock, the business can raise money and use it to fund market expansion potential.
What is stock trading?
Trading involves following the short-term price fluctuations of different stocks closely and then trying to buy low and sell high or vice versa to capitalize on price changes.
This short to medium-term approach is what sets stock traders apart from traditional stock market investors who tend to be in it for the long haul.
Investors buy shares outright in the hope that they will increase in price and can be sold later for a profit. They uphold the traditional mantra of buying low and selling high – known as going long. Investors will take positions over a longer period, attempting to profit from share price changes as well as dividend payments.
While this means that they might need more initial capital to get started when compared to trading, their losses would be capped at this initial outlay. That said, investors should be aware that they might receive back less than they initially invested.
Traders, on the other hand, might be seeking to capitalize on short-term ups and downs. Rather than investing in the shares, traders speculate on the share’s value. They can speculate on it rising by going long, as well as falling by going short.
This is made possible by trading with derivatives like CFDs (Contract for Differences).
Leverage is available when you use this product, which gives you full market exposure for an initial deposit – known as margin – to open your position. But bear in mind that leverage can increase both your profits and your losses as they will be based on the full exposure of the trade, not just the margin requirement needed to open it. This means that losses, as well as profits, could far exceed your margin.
While trading individual stocks can bring quick gains for those who time the market correctly, it also carries the danger of substantial losses. A single company's fortunes can rise more quickly than the market at large, but they can just as easily fall.
Trading can be seen as riskier than investing, due to the use of leverage. But, investing also carries risk – and there is no guarantee that your investments would increase in value, so you could receive back less than you initially invested.
Before deciding to trade in shares, you should take steps to manage your risk. For example, stop-losses enable you to define your exit points for trades that move against you, while limit orders will close a trade after the market moves by a certain amount in your favour.
Consider using the educational resources we offer like CAPEX Academy or a demo trading account.
We’ve got courses at CAPEX Academy that take you through risk management and how to mitigate your exposure to risk in the financial markets.
Our demo account is a proper place for you to learn more about leveraged trading, and you’ll be able to get an intimate understanding of how CFDs work – as well as what it’s like to trade with leverage – before risking real capital. For this reason, a demo account with us is a great tool for investors who are looking to make a transition to leveraged trading.
When you create a CFD account with us, you’ll gain access to:
- Individual stock trading - ‘Buy’ (go long) or ‘sell’ (go short) 2,000 international shares to speculate on their price rising or falling
- Fractional, unleveraged stock trading - Trade over 50 famous U.S-listed shares without having to worry about any commissions and rollover fees
- Thematic trading - gain exposure to the movements of a specific trend or ‘theme’ such as meme stocks, social media stocks, EV stocks, and many other ThematiX
- Basket trading - take a position on a group of stocks simultaneously, grouped together into one index or ETF.
Stock trading examples
To help you understand how to trade stocks, we have compiled two examples of CFD trades and their outcomes.

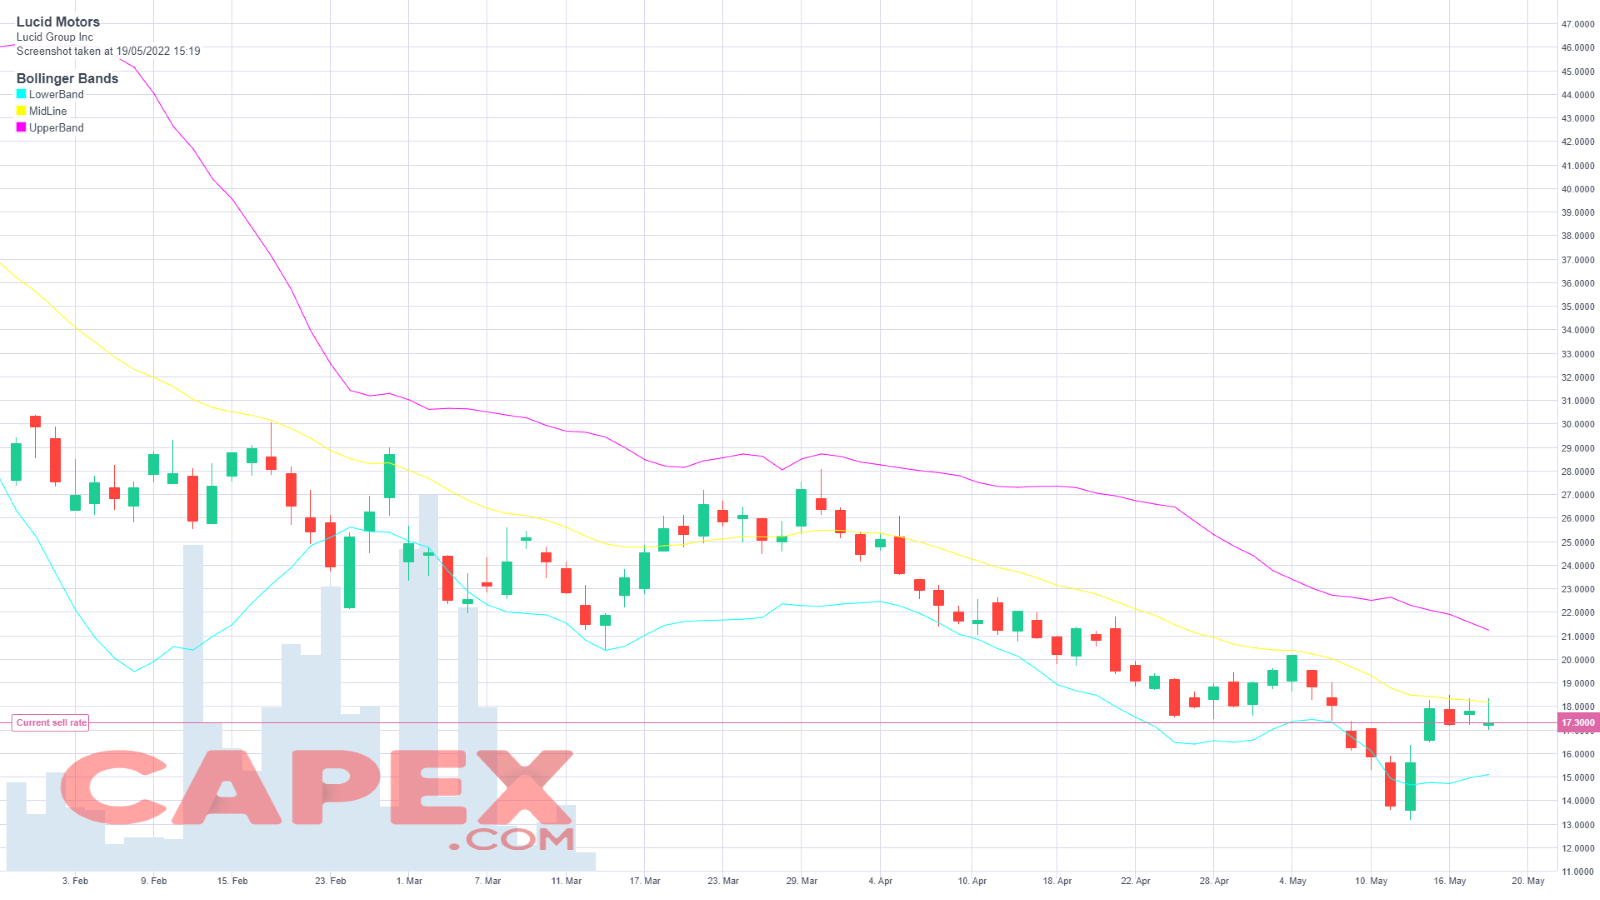
Lucid trading example: buying Lucid or going long
Let’s assume that Lucid Motors shares is trading at a sell/buy price of 17.30/17.40 USD. You want to buy 100 CFD (units) because you think the price of LCID will go up. Lucid Motors has a 1:5 leverage or a margin rate of 20%, which means that you must deposit only 20% of the position’s value as position margin.
In this example, your CFD position margin will be $3.480 (20% x (100 x $17.400 buy price)).
Outcome A: a profitable trade
If your prediction was correct, and the price of Lucid Motors shares surges over the next hours or days, then you have made a profitable trade. If the sell/buy price is 22.20/22.30 USD when you decide to close your position by selling at 22.20 (the new sell price).
The price has moved $4.80 (22.20 – 17.40) in your favor. Multiply this by the size of your position (100 contracts) to calculate your gross profit which is $480.
If the position was closed during the day, there will not be any swap charges and the net profit is $480.
If the position was closed after a few days, there will be swap charges according to the overnight rollover specification.
Outcome B: a losing trade
If your prediction for the price of Lucid Motors was wrong, the LCID CFD trade will result in a loss. Let’s assume that the price of Lucid Motors drops over the next hour to a sell/buy price of $14.70/14.80. Because you want to limit the loss in the eventuality that the price continues to drop, you can sell at $14.70 (the new sell price) to close the position.
The price has moved $2.70 (17.40 - 14.70) against you. Multiply this by the size of your position (1 units) to calculate your loss, which is $270.
Google trading example: selling Google or going short
Let's assume Google is trading at a sell/buy price of 2248/2250 USD, and you want to sell 1.5 CFDs (units) because you think the price will go down. Google has a 1:2 leverage or a margin rate of 20%, which means that you only must deposit 20% of the position’s value as position margin.
In this Google trading example, your CFD position margin will be $2248 (20% x (1.5 units x $2248 sell price)). Remember that if the price moves against you, it is possible to lose more than your initial position margin of $674.4.
Outcome A: a profitable trade
Your prediction was correct, and the price falls later to a sell/buy price of 1960/1962 USD. You decide to close your trade by buying back at $1962 (the new buy price).
The price has moved $286 (2248 - 1962) in your favor. Multiply this by the size of your position (1.5 units) to calculate your profit, which is $429 gross.
If the position was closed after more than 1 day, the overnight swap will be added to the profit according to the overnight rollover specification.
Outcome B: a losing trade
Unfortunately, your prediction was wrong, and the price of Google rises over the next hour to a sell/buy price of 2360/2362 USD. You feel the price is likely to continue up, so to limit your potential loss you decide to buy at $2362 (the new buy price) to close the position.
The price has moved 114$ (2362 - 2248) against you. Multiply this by the size of your position (0.5 units) to calculate your loss, which is $171.
Types of stocks available
To help arrange the larger stock market, stocks can be divided into several categories. These may consist of:
- Top stocks, often known as top performers or blue-chip stocks, are the best-performing securities in each industry and often the largest companies in the world.
- Dividend stocks that prioritize providing a high dividend yield relative to the broader market
- Tech stocks, which refer to any stock in the technology industry, from Artificial Intelligence stocks to metaverse stocks, blockchain stocks, and not only.
In this part, we examine growth stocks, value stocks, and penny stocks—three of the most fascinating and frequently referenced stock categories.
Growth stocks
A growth stock is a company stock that is suspected to experience growth that surpasses the market average. Therefore, it is a faster-growing company when compared with its competitors. These companies typically do not offer dividends due to the fact they often reinvest any earnings that accrue to expedite their growth. Artificial Intelligence stocks are a good example of growth stocks.
Value stock
A value stock is a company stock that is undervalued when compared to its intrinsic value. Investors attempt to estimate a company’s intrinsic value by vigorously analyzing a company’s fundamentals. Therefore, a value stock generally has a good price relative to the company’s success on paper. Investors often buy value stocks as they can provide consistent dividend yields and stable growth forecasts.
Penny stocks
A penny stock is a share that has a value worth below £1 in the UK or below $5 in the US. Their value is the only thing that characterises them against other stocks. When trading penny stocks, it is best to trade with care as they can be very volatile. However, if you pick the right penny stock, you can experience significant growth in comparison to larger stocks due to the low share price.
Stock Trading Styles
There is a range of styles used to accomplish a stock trading strategy, each with appropriate market environments and risks inherent in the strategy.
Position trading
High-Frequency Trading (HFT)
Position trading means taking a longer-term position to ride a trend by entering on a pullback to key support, waiting to see if that support holds, and then going long soon after the longer-term trend bounces back up from support and resumes. This style is associated with longer-term trends (so pay attention to the relevant long-term fundamentals). HFT is an algorithmic trading strategy used by quant traders. This involves developing algorithms and trading robots that help quickly enter and exit a crypto asset. Developing such bots needs an understanding of complex market concepts and a strong knowledge of mathematics and computer science. Therefore, it is more suited for advanced traders than beginners.
Swing Trading
Day Trading
Scalping
Swing trading involves entering just after a trend reverses briefly, then resumes. You enter just as price is pushing or “swinging” past its former resistance, which indicates that the crypto trend has found new strength. Successful swing trading relies on the interpretation of the length and duration of each swing, as these define important support and resistance levels. Day trading involves taking positions and exiting on the same day. The aim of a trader while adopting such a trade is to book profits amid intraday price movements in a stock of his choice. For an intraday trade, investors often rely on technical indicators to figure out entry and exit points. Scalping is a method of trading where the trader typically makes multiple trades each day, trying to profit off small price movements. Although there is risk involved, a stock trader takes care of the margin requirement and other important rules to avoid bad trading experiences. Scalpers analyze the stock, past trends, and volumes and choose an entry and exit point within minutes.
Stock Trading Strategies
There are many techniques traders use to speculate on the price fluctuations in the stock markets. A stock trader should devise a powerful strategy backed by research, with well-laid plans for when to enter and exit their positions.
Trend Trading
A trend-following strategy is based on the expectation that the direction of price will continue in its current form and the trend will not reverse. This means that if you are trading an uptrend, you could continue to hold your long position and watch stock price increase in value, while you could choose to sell your asset if the trend is going downward. Trend traders do not have a fixed view of where the market should go or in which direction.
Range trading
A trading range occurs when a stock trades between consistent high and low prices for a period. Stock traders use various technical analysis approaches to identify major support and resistance levels before entering the market: sell near resistance and buy near support.
Breakout Trading
The hypothesis behind breakout trading is quite simple. If support and resistance levels keep the price contained in a range, the break of that range might indicate a larger move. A breakout trader may enter a long or short position once the price has moved outside of the defined support or resistance area. These levels and the chart patterns that provide the basis for the breakouts might be interpreted differently by different traders. If the price breaks outside of a defined range but quickly reverses, it may be considered a fakeout, or false breakout.
News Trading
News can be specific to a particular stock, or it can affect an entire industry or the markets. Much of the news that moves the markets is scheduled, such as earnings reports and economic updates. Periodic or recurring news includes the scheduled releases of news that moves the markets, including interest rate announcements by the Federal Reserve, economic data releases, and quarterly earnings reports from companies. Unexpected or one-time news such as a terrorist attack, a sudden geopolitical flare-up, or the threat of debt default by an indebted nation. As a rule of thumb, unexpected news is more likely to be bad than good.
Stock Trading Guide for Beginners
If you're trying your hand at stock trading for the first time, know that most investors are best served by keeping things simple and investing in a diversified mix of low-cost index funds to achieve — and this is key — long-term outperformance.
That said, the logistics of trading stocks come down to five steps:
1. Open a trading account
Stock trading requires funding a brokerage account — a specific type of account designed to give everyone the chance to invest in the companies they follow and are interested in without owning the shares - just by trading the price movements. You can open one with CAPEX in a few minutes. But don’t worry, opening an account doesn’t mean you’re investing your money quite yet. It just gives you the option to do so once you’re ready.
We’ve got a truly market-leading share offering for traders – with over 2,000 international shares and ETFs and a host of global indices.
With us, you’ll also have access to fractional shares. This lets you take a position on over 50 leading U.S-listed shares without having to worry about any fees for rolling your transaction from one day to the next. Also, with our 1:1 leverage policy, you can manage your portfolio in a more balanced and transparent way.
So, if you want to take a position on shares, you’ve come to the right place. We offer CFDs to retail traders who are looking to seize their next opportunity.
2. Learn to use market orders and limit orders
Once you have your brokerage account and budget in place, you can use your online broker's website or trading platform to place your stock trades. You'll be presented with several options for order types, which dictate how your trade goes through. Here are the two most common types:
Market order
A market order is an order to buy or sell a stock at the market's current best available price. A market order typically ensures an execution, but it does not guarantee a specified price. Market orders are optimal when the primary goal is to execute the trade immediately. A market order is appropriate when you think a stock is priced right, when you are sure you want a fill on your order, or when you want an immediate execution.
Limit order
A limit order is an order to buy or sell a stock with a restriction on the maximum price to be paid or the minimum price to be received (the "limit price"). If the order is filled, it will only be at the specified limit price or better. However, there is no assurance of execution. A limit order may be appropriate when you think you can buy at a price lower than--or sell at a price higher than--the current quote.
Stop order
A stop order is an order to buy or sell a stock at the market price once the stock has traded at or through a specified price (the "stop price"). If the stock reaches the stop price, the order becomes a market order and is filled at the next available market price. If the stock fails to reach the stop price, the order is not executed.
A stop order may be appropriate in these scenarios:
- When a stock you own has risen and you want to attempt to protect your gain should it begin to fall
- When you want to buy a stock as it breaks out above a certain level, believing that it will continue to rise
3. Discover what moves the price of shares
Before it goes public through an IPO, a company’s shares will have a set price range – often determined by the underwriter of the IPO (normally a large bank). This range will be set according to the anticipated interest in the listing, as well as the company’s fundamentals – including its revenues, its products, and its existing popularity.
Once the IPO has been completed, fluctuations in the share price are caused by changes in the supply of and demand for the stock. If supply is higher than demand, the share price could fall; if demand is higher than supply, the share price could rise.
In the long term, there is a range of reasons that the demand for a share can fluctuate over time. These reasons include:
Earnings reports
Companies usually release interim reports on their financial performance once every quarter and a full report once a year. These reports can influence a company’s share price as traders and investors use figures including revenue, profit, and earnings per share (EPS) as part of their fundamental analysis.
Macroeconomic data
The state of the economy a company operates in will affect its growth. Data releases such as gross domestic product (GDP) and retail sales can have a considerable influence on company share prices – strong data can cause them to rise, while weak data can cause them to fall.
Market sentiment
Share price movements are not always based on fundamental analysis. The view that the public, as well as market participants, have on a particular stock can cause demand to fluctuate. This is how some speculative bubbles are formed.
Interest rates
If interest rates are low, the stock market might see increased activity – despite the previous factors mentioned here. That’s because more people could turn to stocks and shares to achieve greater returns than they might otherwise be able to if they saved their money in a bank account.
4. Pick a stock or basket of stocks
We’ve got over 2,000 international stocks, ThematiX, and ETFs for you to choose from.
When you’re choosing a stock, it’s important that you carry out your own due diligence on a company. You should use both fundamental and technical analysis when assessing a company’s financials and potential future share price performance.
Fundamental analysis
Fundamental analysis is based on a company’s financial metrics, including its net revenue, earnings calls, or profit and loss statements.
Consider looking for stocks with a low P/E, for example, greater than zero (shows the company is profitable) but less than five. Also, consider looking at stocks where the Forward P/E is lower than the current P/E. This shows earnings are expected to increase, and if they do the stock is a better buy at the current price.
IPO date should be more than a year ago; preference is given to stocks that have been publicly traded for 10 years or more.
Look for prices over $2 per share, no penny stocks. Also, take into consideration the average volume (over 300,000 shares) and operating margin (over 10%).
If dividend stocks are on your radar, look for a yield over 5%, but a pay-out ratio below 100%.
Screening for stocks based on the filters above will produce a list of trade candidates. Usually all are not worthy of investment though.
Technical analysis
Technical analysis is concerned with chart patterns, technical indicators, and historical price action.
View charts of the stocks produced by the screeners above (fundamentals). The next criteria for opening a long position is:
- Only open a buy position at the major long-term support area. Traders want to go long at cheap prices (compared to historical values), not expensive prices. Investment trades don’t require a stop loss, but you should have a price in mind where you get out if conditions don’t improve for the stock. An investment doesn’t mean you hold it forever if it doesn’t do what you expect. Have a low tolerance for stocks that keep dropping.
Also, have an exit plan for how you will exit a profitable or losing trade. Define how and why you will exit. Since we used to support to get into the trade, you may consider exiting just below a long-term resistance level. Once you are out of your trade, don’t worry about what the stock does after. Take the money and trade other stocks, going through the same process again, as discussed above.
This brings us to one final guideline on how to pick stocks:
- If buying at the support line planning to exit just below the resistance line, the upside potential should outweigh the downside risk. In many cases, market strategists find the ideal risk/reward ratio for their investments to be approximately 1:3, or three units of expected return for every one unit of additional risk. Traders can manage risk/reward more directly using stop-loss and take-profit orders.
5. Choose your timeframe and open your position
Timeframes are important considerations when you’re deciding how to take a position on stocks.
Each Japanese candle presents the price action over a specific period, or to use traders’ jargon, a time frame. Most trading platforms’ charting modules allow you to view candles representing time frames ranging anywhere from a minute to a month.
The trend, meaning the overall price direction, that you’ll see on any chart depends greatly on your time frame. The longer the chart’s time frame, the more established and reliable the key price levels and other support/resistance indicators.
For whatever time frame you trade from, remember to always check:
- At least one longer time frame to get a sense of the bigger overall trend within which you’re trading. Ideally, you want to trade in the direction of that larger trend although there will often be tradable counter moves within the longer-term trend. For example, those day trading stocks would check weekly charts for the major trend.
- At least one shorter time frame to check the minor trends and support/resistance levels nested within your trading time frame so you know where the trend may pause or reverse and be a possible exit point to take profits or cut losses. For example, those day trading stock would look at four-hour and one-hour charts.
The 10 timeframes available on our award-winning platform enable a comprehensive detailed analysis of all minor price movements. More than 80 technical indicators and analytical tools, including graphic objects, provide detailed analysis of quote dynamics.
You also gain access to Trading Central, which delivers analysis and recommendations from real financial experts. Additionally, you get precious market intel from TipRanks: Daily Analyst Ratings, Bloggers' Opinions, Insiders' Hot Stocks, Hedge Fund Activities, and News Sentiment.
When you trade with CFDs at CAPEX.com, you’ll find that the spreads are tighter and there is no commission for opening and closing trades, but you’ll incur rollover charges for positions maintained overnight. We also offer actional shares that give you instant access to trade CFDs on shares on the largest U.S-listed companies with no leverage and no swap fees on long positions, so you don’t have to worry about rolling your long position from one day to the next.

Where to trade stocks
Stocks are traded on a major centralized stock exchange for each country, such as the New York Stock Exchange (NYSE), NASDAQ, or London Stock Exchange (LSE). With CFD trading you can trade over 2,000 shares & ETFs on our advanced platform that is available on both desktop and mobile devices.
Stock trading platform
Our stock CFD trading platform is designed to be adaptable to your specific trading needs. Suitable for traders of all levels, our WebTrader platform combines the latest innovations with an easy-to-use interface.
Stock trading app
Our platform features can also be accessed on our award-winning native mobile trading application. This application has been specifically designed so that you can trade as if you were on a desktop device, with full order-ticket functionality and advanced charting features.
Free resources
Before you start trading stocks, you should consider using the educational resources we offer like CAPEX Academy or a demo trading account. CAPEX Academy has lots of free trading courses for you to choose from, and they all tackle a different financial concept or process – like the basics of analyses – to help you to become a better trader or make more-informed investment decisions.
Our demo account is a suitable place for you to learn more about leveraged trading, and you’ll be able to get an intimate understanding of how CFDs work – as well as what it’s like to trade with leverage – before risking real capital. For this reason, a demo account with us is a great tool for investors who are looking to make a transition to leveraged trading.