


Here are the latest details from the U.S. Energy Information Administration regarding natural gas inventories for the past week.
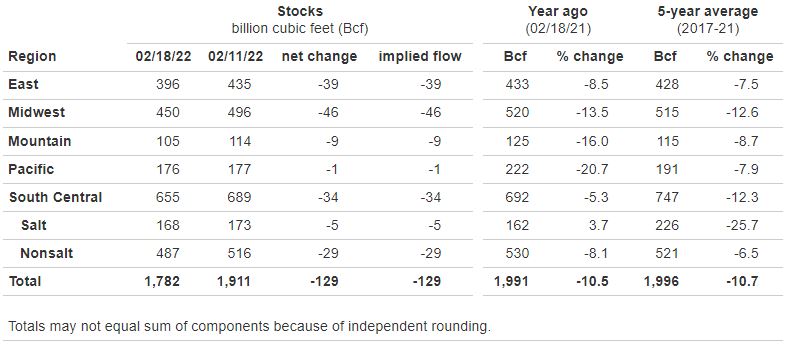
Working gas in storage was 1,782 Bcf as of Friday, February 18, 2022, according to EIA estimates. This represents a net decrease of 129 Bcf from the previous week. Stocks were 209 Bcf less than last year at this time and 214 Bcf below the five-year average of 1,996 Bcf. At 1,782 Bcf, the total working gas is within the five-year historical range.

Don’t Miss this Week's EIA Natural Gas Storage Indicator
- You can use our free economic calendar to prepare for data releases
- Start trading market volatility around macroeconomic data releases by opening a live account with CAPEX.com. Alternatively, you can practise trading with a CAPEX.com demo account.
- Visit CAPEX Academy to learn more about macroeconomic indicators and events.
What Is the Natural Gas Storage Indicator?
The Natural Gas Storage Indicator is the U.S. Energy Information Administration's (EIA) estimate of working natural gas volumes held in underground storage facilities at the national and regional levels. The EIA provides weekly estimates of working gas volumes held in underground storage facilities at the Lower 48 states and five regional levels.
Changes in these gas inventories on a weekly basis primarily reflect net withdrawals or injections. The report is generally updated and available every Thursday at 10:30 am EST. Unexpected changes such as above-average withdrawals or injections can have an immediate impact on natural gas prices.
Understanding the Natural Gas Storage Indicator (EIA Report)
The Natural Gas Storage Indicator provides estimates of the working gas volumes held in the U.S. underground reservoirs. Weekly reports of the gas volumes are made and are expressed in billion cubic feet (Bcf) units. The most significant type of gas storage is in underground storage reservoirs.
Underground reservoirs come in three main categories: salt formation, depleted gas reservoir, and aquifer reservoir. Base gas and working gas are two categories of natural gas kept in subterranean storage facilities. The amount of permanent storage is referred to as the base gas. The amount of natural gas that is readily available on the market is referred to as the "working gas," and it is equal to the entire amount of gas in storage less the base gas.
Both on a national (lower 48 states) and regional scale, the amount of workable gas is estimated. East, Midwest, Mountain, Pacific, and South-Central are the divisions used to group the regions. Salt and non-salt lands are further divided into the South-Central region.
The EIA must establish a distinction between the two groups since storage in salt locations is typically more expensive than in non-salt areas. The Mountain region typically maintains the lowest level of stocks, while the South-Central region—especially without salt—holds the largest level.
Based on survey information gathered from a selection of representative underground storage facilities, the working gas volumes in storage are approximated. As a result, the EIA additionally publishes standard errors for net change and stock coefficients of variation along with the indicator.
Why is the Natural Gas Storage Indicator important for traders and investors?
The net change in the inventory levels of natural gas is determined by the volumes of withdrawals and injections. Unexpected variations in withdrawal and injection quantities could have a big effect on natural gas prices. As a result, the Natural Gas Storage Indicator is a crucial piece of information for traders of natural gas.
Because traders are negative on the gas market, an unexpected rise in gas stocks could be caused by more injections (supply) or fewer withdrawals (demand). Either scenario could result in a decline in gas prices. A lower-than-anticipated rise or decline in inventories could indicate a higher demand for natural gas with higher withdrawals. As a result, traders will be bullish on gas prices. For instance, a surprisingly cold winter increases the need for heating, which raises both the demand for and the cost of natural gas.
History and Goal
Weekly estimates of working gas in storage were first provided by the American Gas Association (AGA) in 1994, however, by 2001, the AGA decided that it would discontinue its survey due to resource considerations. The EIA stepped in to fill the information gap in the natural gas market and released its first estimates of underground U.S. natural gas storage for the week ending May 3, 2002.
According to the EIA, the goal of the weekly storage data program is to provide weekly estimates of the level of working gas in underground storage for the United States and five regions. The total volume of natural gas in underground storage reservoirs is classified as either base gas or working gas. Underground storage facilities may be reservoirs in depleted oil and gas fields, aquifers, or salt caverns.
Who publishes the Natural Gas Storage Indicator?
The Natural Gas Storage Indicator is sourced directly from the U.S. Energy Information Administration (EIA). The EIA is a statistical and analytical agency within the U.S. Department of Energy that provides independent and impartial energy information to support policymaking, market analysis, and public understanding of energy-related issues.
The data is collected through surveys of oil companies, refineries, and storage facilities. In addition to the Weekly Petroleum Status Report, the EIA also releases other energy-related reports, e.g., the Weekly Natural Gas Storage Report, Weekly Coal Production Report, and Gasoline and Diesel Fuel Updates.
According to the EIA Information Quality Guidelines, the federal agency ensures the objectivity, utility, and integrity of the information that it releases. It also aims for transparency and reproducibility for influential information. The standards make the Natural Gas Storage Indicator a reliable resource for gas traders to estimate gas prices and make trading decisions.
How to Trade and Invest in Natural Gas with CAPEX.com?
- Research your markets – you can get direct exposure to Natural Gas price movements through futures contracts and Nat Gas ETFs, or indirect exposure through shares of Gas sector companies and energy ETFs.
- Define your strategy – trading lets you speculate on the price movement; dealing lets you take direct ownership of the stocks and ETFs.
- Take your position – create an account with us to trade and invest in Natural Gas.