


Biden’s Victory
Yesterday, Joe Biden won in Pennsylvania and Nevada. The Democratic candidate rose his votes in the electoral college to 290 and became the US president-elect. Investors took a sigh of relief as this news offered some certainty, and above, the market may now enjoy fewer disturbances that came from Trump’s abrupt tweets.
Tech Stocks Rally…For Now
Major indices rallied, as the US looks on the way to have a divided Congress. This is good news for the tech companies as a Republican senate will hinder Biden from imposing higher taxes and more regulations. However, the market still focused on the undecided of two runoff elections in Georgia on January 5. A Democrat win would flip the situation in the Senate and allow Biden from passing his legislative agenda.
Key Data Releases in the Week ahead
On Monday, November 9, the market expects Switzerland’s unemployment rates of October, the ECB president’s Lagarde’s speech, and the BoE governor Bailey‘s speech, then-Fed members speeches Mester’s and Harker’s, respectively.
On Tuesday, November 10, investors will find out about the Chinese inflation rate number of November, the UK unemployment rate of September, and the Eurozone ZEW index of November. Later on, the Fed member Quarles will deliver a speech.
On Wednesday, November 11, eyes will be on the RBNZ interest rate decision and press conference, then the ECB president Lagarde’s and vice president Guindo’s speeches.
On Thursday, November 12, traders will follow Germany’s inflation numbers of October, the UK GDP (Q3), the BoE governor Bailey’s speech, the US inflation rate of October, the ECB president Lagarde’s speech with Fed members speeches Evens and Williams.
On Friday, November 13, markets will check the Eurozone GDP (Q3) number, then will tune in Fed member speeches Williams and Bullard. Finally, the market will know about Michigan’s index number and will hear BoE governor Bailey’s speech.
Looking for a regulated company? Open now a trading account with Capex.com
NASDAQ- Daily Price Chart (September 1 – November 9, 2020)

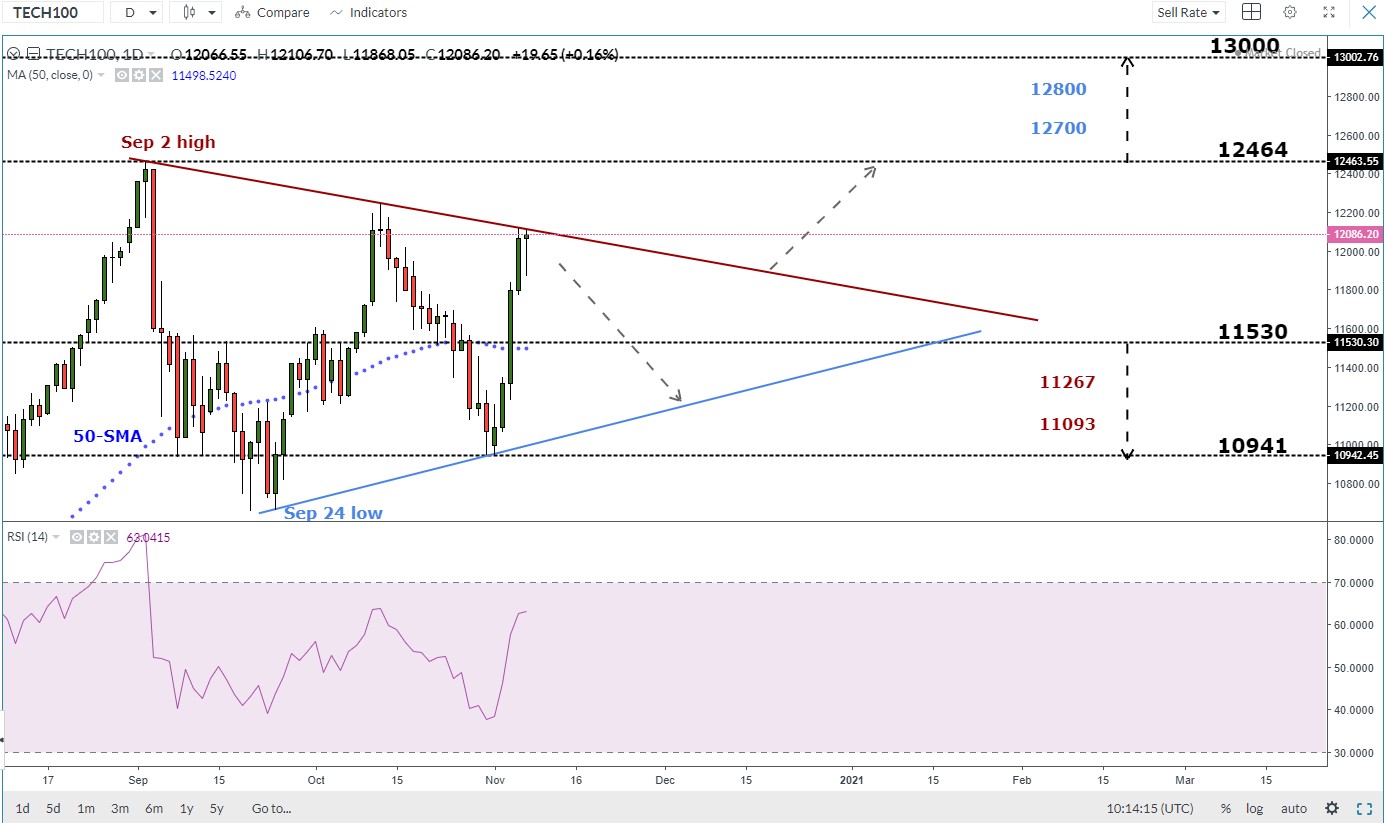
On November 4, the NASDAQ climbed to the current trading zone 11530- 12464 and closed above the 50-day simple moving average indicating that bulls were back. The price rebounded from the upper line of the ascending triangle and may fall towards the lower line of it.
A daily close below the low end of the trading zone at 11530 could send the price for a test of the November 2 low at 10941.
On the other hand, a daily close above the high end of the zone at 12464 may encourage bulls to rally the price towards the next psychological level at 13000.
NASDAQ- Four Hour Price Chart (October 7 – November 9, 2020)
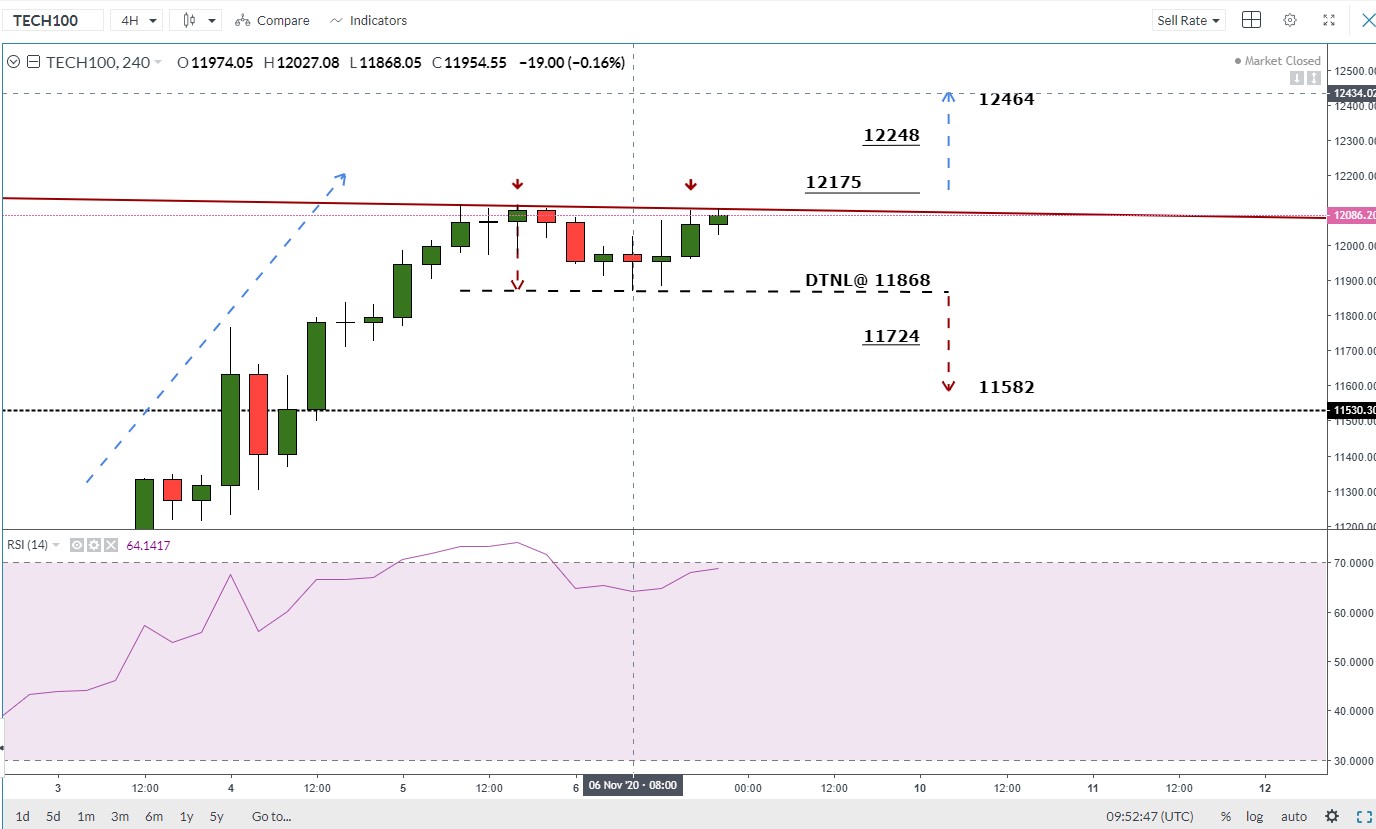
On November 3, the NASDAQ started an upward trend creating higher highs with higher lows. However, it lost momentum as rebounded on multiple occasions around 12000 and developed a double top pattern where the neckline resides at 11868.
In conclusion, while the bullish pattern still in place a break below the neckline of the aforementioned double top pattern may correct the price lower and could send it towards 11582. On the flip side, a break above 12175 may cause a rally towards 12464. As such, the support and resistance levels underlined on the chart should be considered.

