


Key Events
On Monday, September 21, markets
await the ECB president Lagarde’s speech and the Fed member Brainard’s speech.
On Tuesday, September 22,
traders will tune in the Fed’s members Kaplan, Williams, and Evan’s speeches
and the Fed chairman Powell’s testimony before the US Congress.
On Wednesday, September 23,
markets will find out about the RBNZ rate’s decision, the Eurozone, the UK, and
the US flash (primary) PMI data for September. The Fed Chairman will continue
its testimony before Congress, and the change in the US oil stockpile levels will
be released. By the end of the day, investors expect the Fed members Evan, and
Quarles's speeches.
On Thursday, September 24,
eyes will be on the Bank of Japan monetary policy minutes, the SNB rate
decision, the ECB economic bulletin, the German IFO business climate data, the
US initial jobless claims, and the Bank of England governor’s Bailey speech.
On Friday, September 25, Markets
will follow the European council's special meeting, the US durable goods data
for August, and the Fed Williams speech.
Looking for a regulated company in the UAE? Open now a
trading account with Capex.com
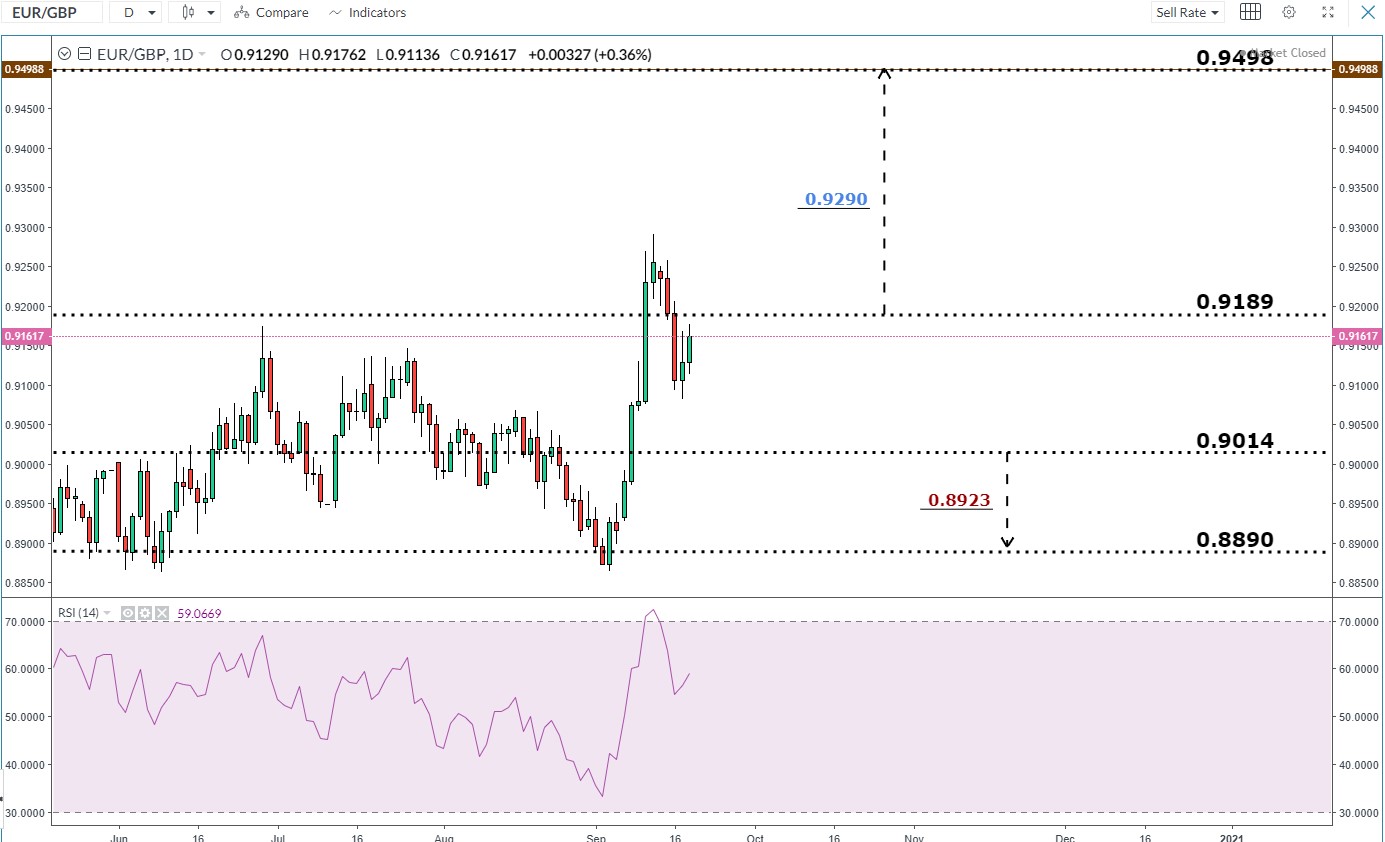
EUR/GBP Daily Price Chart (June 19 - September 20, 2020)
On September 11, EUR/GBP
climbed to a near six-month high at 0.9290. Last week, the price retreated to a
lower trading zone 0.9189 – 0.9014 then closed a weekly candlestick in the red
with a 1.0% loss. A daily close above the high
end of the trading zone ie, above 0.9189 signals that bulls may try to re-test
the March 19 high at 0.9498. On the other hand, a daily
close below the low end of the zone ie, below 0.9014 may encourage bears to
press towards the monthly support level at 0.8890 ( the July 2019 low). EUR/GBP Four Hour Price Chart ( August 27- September 20, 2020)


On September 16, EUR/GBP traded
below the bullish trendline support originated from the September 3 low at
0.8864 and changed the price trend from bullish to sideways. Therefore, a break above
0.9206 may trigger a rally towards the September 11 high at 0.9290, while a
break below the 0.9100 handle could press the pair towards0.9029. As such, the
support and resistance levels underlined on the chart should be kept in focus.

