


Candlestick patterns are essential for identifying potential price reversals and continuations in technical analysis. Today, we'll explore one of the most important patterns: the Evening Star Candlestick Pattern.
Japanese candlesticks can be used to create many different patterns, categorized into various groups such as simple and complex forms, reversal versus continuation, and bullish versus bearish.
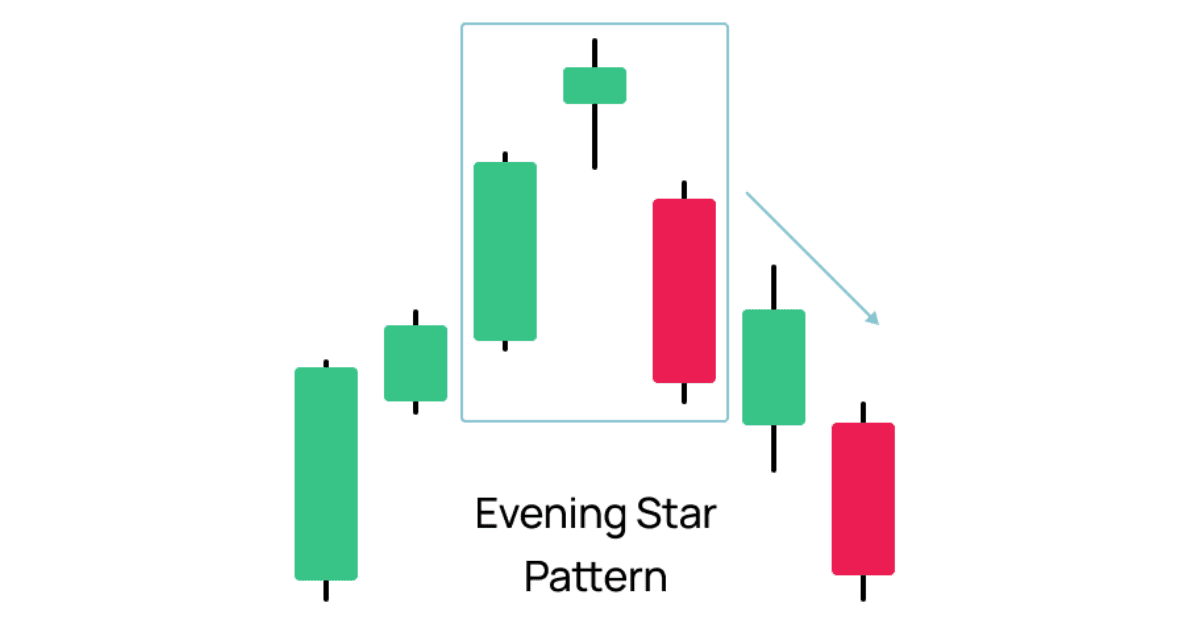
The evening star pattern, consisting of three consecutive candles, is considered a more complex structure and occurs less frequently than simpler, single-candle patterns. In technical analysis, the Evening Star pattern is seen as a bearish reversal signal, typically appearing at the peak of an upward trend. Read this guide to learn more about it.
Evening Star Candle - How to Use this Guide
- To get the most out of this guide, it’s recommended to practice putting these Evening Star candle trading strategies into action.
- The best risk-free way to test these strategies is with a demo account, which gives you access to our trading platform and $50,000 in virtual funds for you to practice with.
- Once you’ve found a strategy that consistently delivers positive results, it’s time to upgrade to a fully funded live account where you can apply your newfound edge.
What is an Evening Star Candlestick?
Evening Star pattern is a three-candle bearish reversal candlestick pattern that emerges at the peak of an uptrend signaling that the upward momentum is slowing down, and setting the stage for a potential decline. It consists of a large bullish candle, followed by a smaller indecisive candle, and finally a large bearish candle that closes below the midpoint of the first candle.
When this pattern appears, it indicates that the current uptrend is likely ending. The Evening Star pattern is the opposite of the Morning Star pattern, which is considered a bullish signal. The significance of the Evening Star lies in its ability to mark the transition from bullish to bearish sentiment, suggesting that sellers are starting to overpower buyers.
As a reversal pattern, the Evening Star typically arises near the peak of an upward trend, indicating an impending shift from a bullish to a bearish market outlook. Though uncommon, it is a reliable indicator in technical analysis. It alerts traders to the potential end of a rally and the beginning of a downturn, allowing them to adjust their positions accordingly.

Savvy traders use the Evening Star pattern to anticipate and capitalize on the bearish momentum before others notice the shift. By recognizing this pattern early and combining it with other indicators on the charts patterns, traders can enhance their timing decisions, avoiding sudden losses and turning potential market downturns into profitable opportunities.
Understanding and utilizing the Evening Star pattern effectively can significantly improve a trader’s ability to spot and ride market reversals.
How is an Evening Star candlestick formed?
An Evening Star pattern on a candlestick chart consists of three candles. The first candle has a long body, indicating that the closing price is above the opening price, signifying a significant price increase. This bullish candle indicates that the asset price is trending upward.
To identify an Evening Star pattern, consider the following factors:
Preceding Uptrend
The Evening Star pattern usually appears near the peak of an upward trend, indicating a possible reversal.
Candlestick Formation
The pattern consists of three candlesticks. The first is a large bullish (green) candle, reflecting strong buying pressure. The second candle is smaller and can be bullish, bearish, or a Doji, which represents indecision. If the second candle is bearish, it indicates a stronger reversal signal.
Gap
The second candle on Day 2 begins with a bullish gap up, showing initial control by the bulls. However, they fail to significantly raise prices.
Bearish Candle
The third and most crucial candle (Day 3) opens with a bearish gap. Bears take control and push prices further down, often erasing the gains from Day 1.
Compared to candle shadows, candle bodies have more significant properties. The lines above and below a candle body, called shadows, represent the highest and lowest prices within a specific time period. A longer shadow indicates more price variation. Analysts prioritize the open and close prices over the day's trading range when identifying an Evening Star pattern.
Evening star vs Morning star
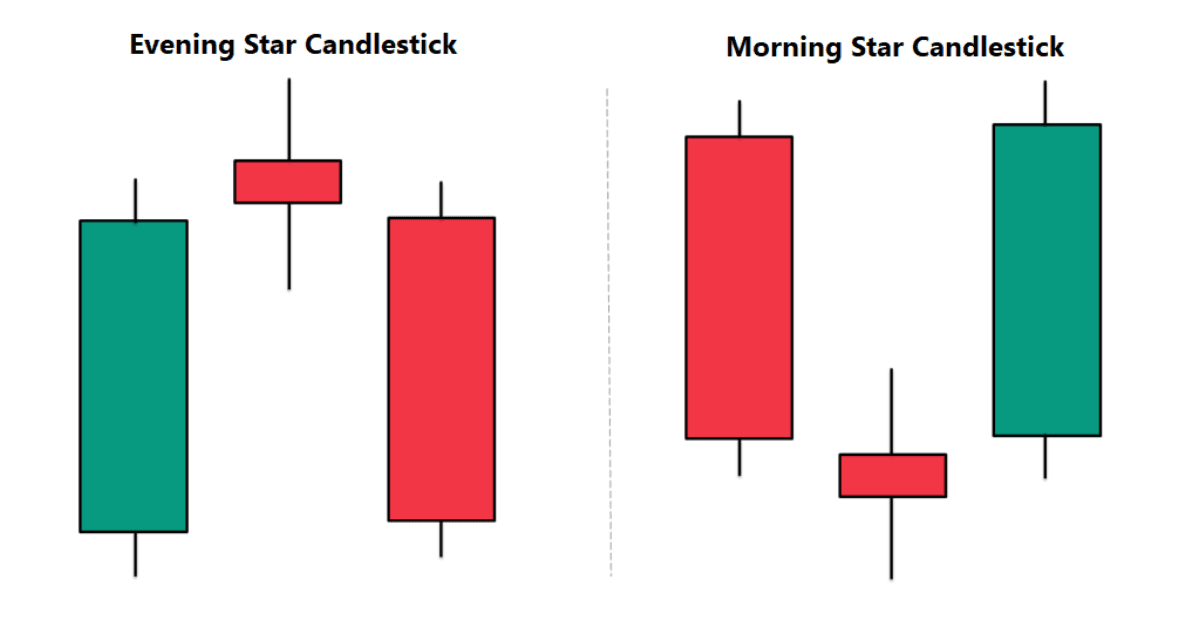
Technical analysts employ the Morning Star and Evening Star candlestick patterns to signal potential reversals in price trends, each displaying distinct characteristics.
At the peak of an uptrend, the Evening Star pattern appears, indicating a potential shift to bearish momentum. This pattern consists of a long bullish candle, a small or neutral "star" candle, and a subsequent bearish confirmation candle. It suggests waning buying pressure and a possible takeover by sellers, likely pushing prices lower.
Conversely, the Morning Star pattern emerges at the bottom of a downtrend, signaling a potential bullish reversal. It comprises a long bearish candle, a small or neutral "star" candle, and a bullish confirmation candle. This pattern indicates reduced selling pressure and the potential for buyers to regain control, potentially driving prices higher.
While the Morning Star indicates a bullish reversal and the Evening Star signals a bearish reversal, there are several other star patterns that assist traders in determining optimal buying or selling opportunities. Although the efficacy of technical analysis as an investment strategy remains debated, traders and analysts rely on these patterns to identify potential entry and exit points and make informed trading decisions.
What sets an Evening Star Candlestick apart from an Evening Star Doji Candlestick?
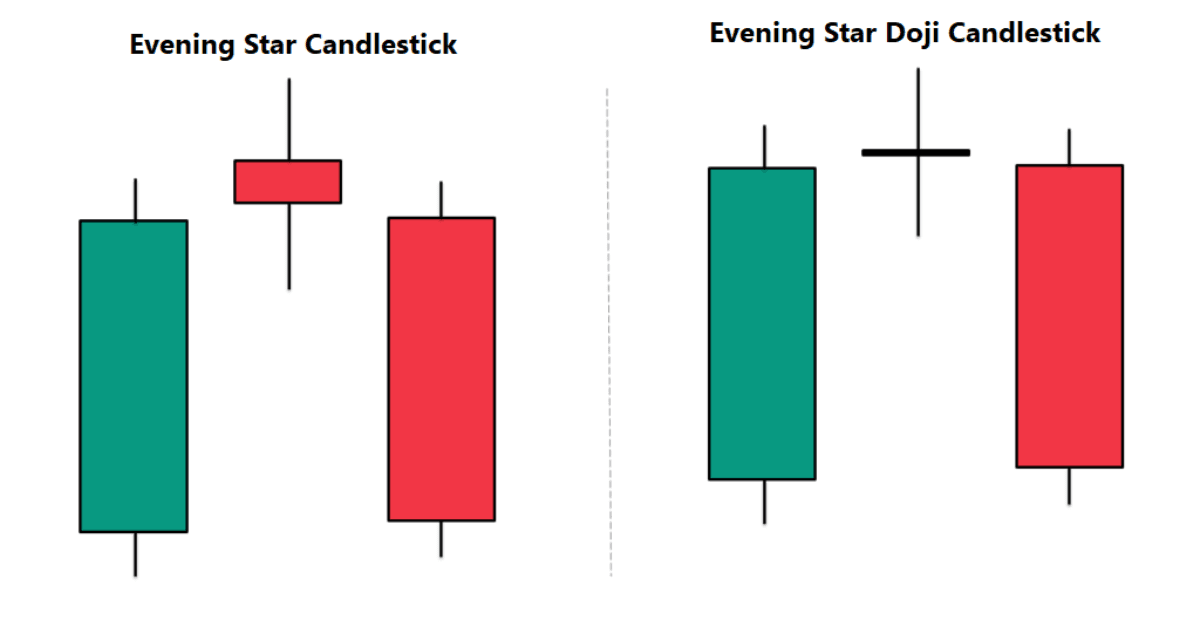
When the market opens and closes at the same level, or very close to it, Doji candles can be observed. This hesitation sets up a bearish move because bears perceive value at this point and aim to halt further buying. This bearish confirmation is provided by the appearance of a bearish candle following the Doji candle.
The main difference between the Morning Star and Evening Star Doji candlestick pattern is the middle candlestick. In a typical Evening Star pattern, the middle candle is a short red body that slopes down after the previous long green candle. In contrast, the middle candlestick in the Evening Star Doji pattern forms a Star Doji with little or no real body.
The doji star reflects market hesitation and uncertainty after a rally. While both models indicate potential reversals after uptrends, doji release requires confirmation from subsequent bearish candles due to the high level of uncertainty.
How to trade Evening Star candlesticks
If you wish to trade after spotting an Evening Star pattern, you can use derivatives like CFDs. With derivatives, you can trade both rising and falling prices. Therefore, you can open a short position based on your prediction of the asset's price movement when an Evening Star pattern appears.
Follow these steps to trade Evening Star pattern:
Identify the pattern. When the evening star pattern forms, look for a bullish trend, as this may indicate a possible trend reversal. Verify the pattern. Wait for additional bearish candlestick patterns or other technical indicators (such as resistance levels or trendlines) that confirm a bearish reversal to increase the signal's reliability. Set a stop loss. Place a stop-loss order above the pattern's highest point to minimize potential losses if the trend reversal does not materialize. Take a short position and monitor the trade. Enter a short trade expecting the price to decline once the pattern is confirmed and the stop loss is set. Monitor the price movement and adjust the take-profit and stop-loss levels as necessary. Where to trade Evening Star candlestick chart pattern:
To get started trading Evening Star candlesticks, open an account. Choose between a live account to trade CFDs straight away or practise first on our demo account with virtual funds. Choose your financial instrument. Evening Star candles can be spotted in most financial markets, especially those that are more volatile, such as forex, cryptocurrencies, and stocks. Explore ours online trading platform. We offer multiple chart types that are not limited to candlestick charts, as well as providing a range of order execution tools for fast trading, which in turn helps you to manage risk.
Trading Strategies with Evening Star Candlestick
Below we explore various Evening Star candle strategies that can be applied to trading.
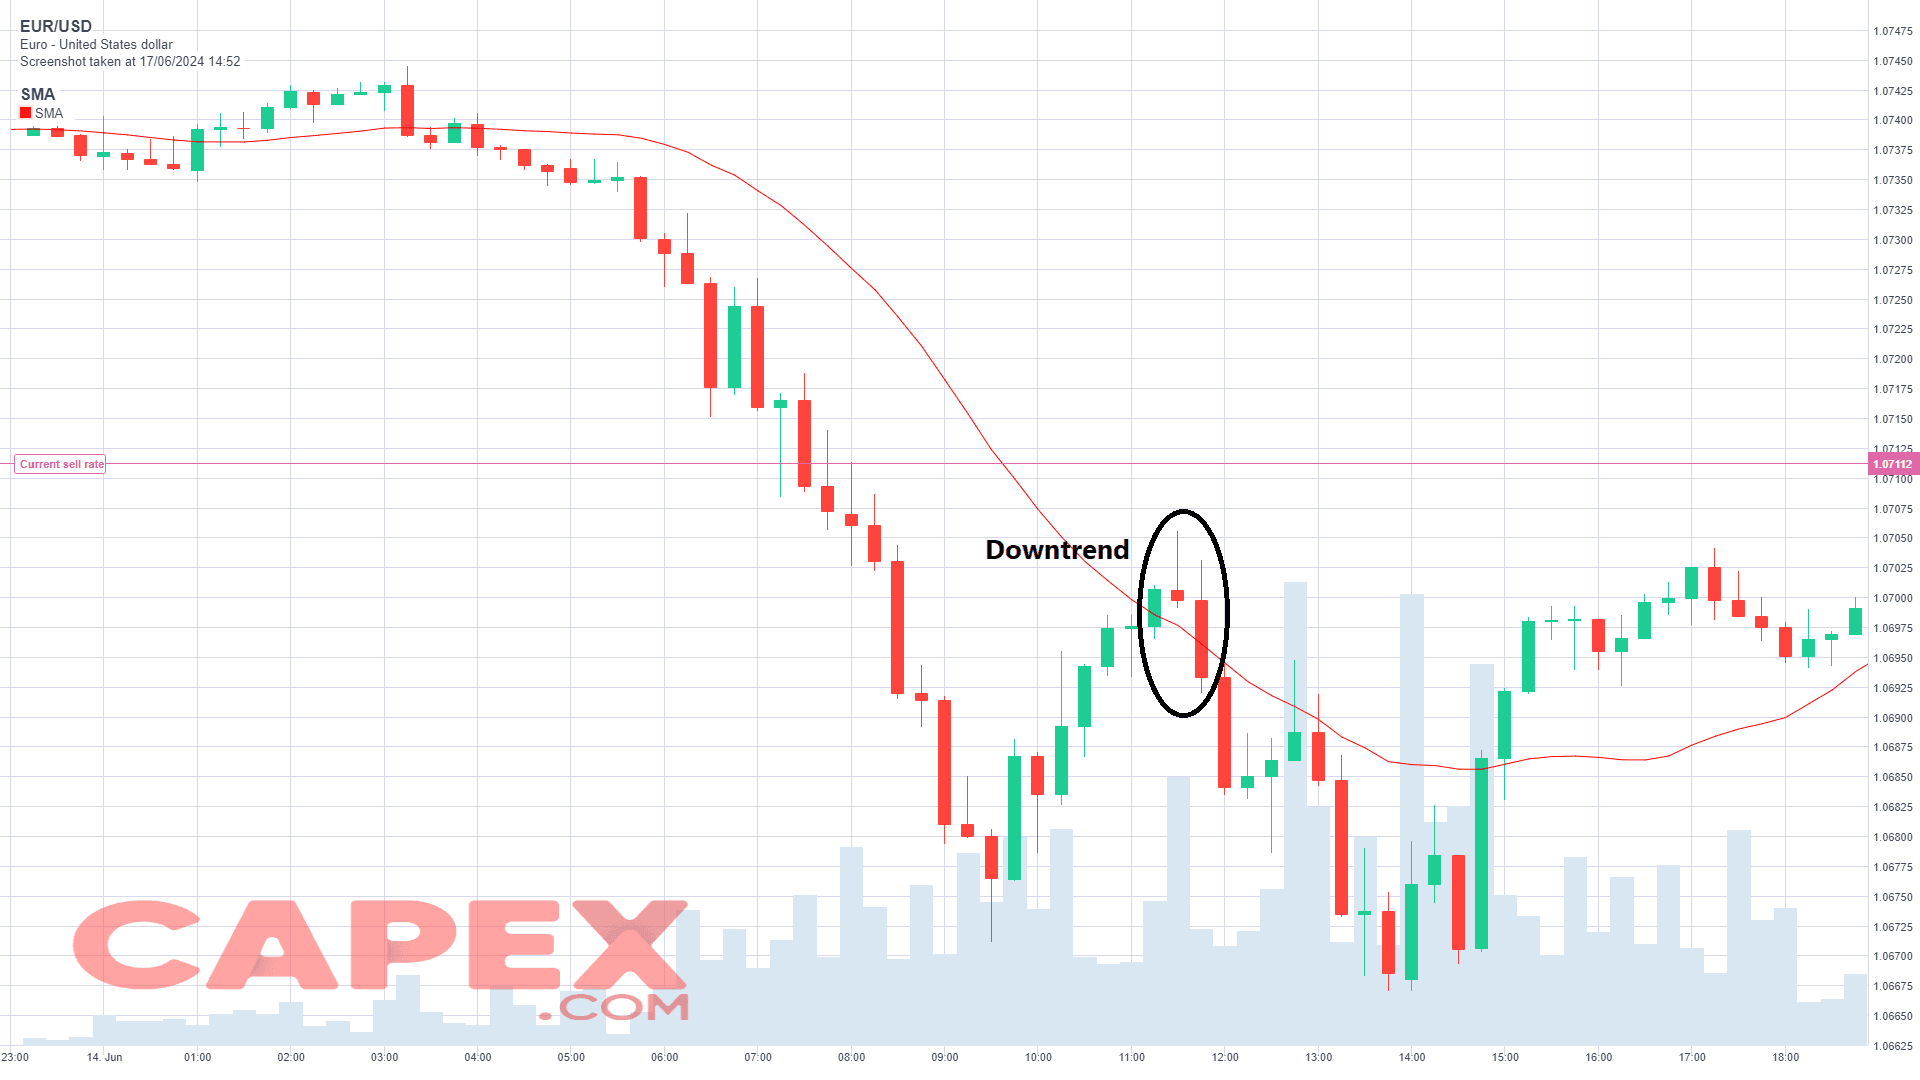
Trading Evening Star pattern with Pullbacks on charts
A chart pattern is a shape within a price chart that suggests potential future price movements based on historical data. Chart patterns are fundamental to technical analysis and require traders to know precisely what to look for. The chart below for EUR/USD shows an evening star candlestick pattern appearing during an overall downtrend. Given that the evening star is a bearish reversal pattern, its appearance within the downward trend signals to traders a likely continuation of the bearish trend.
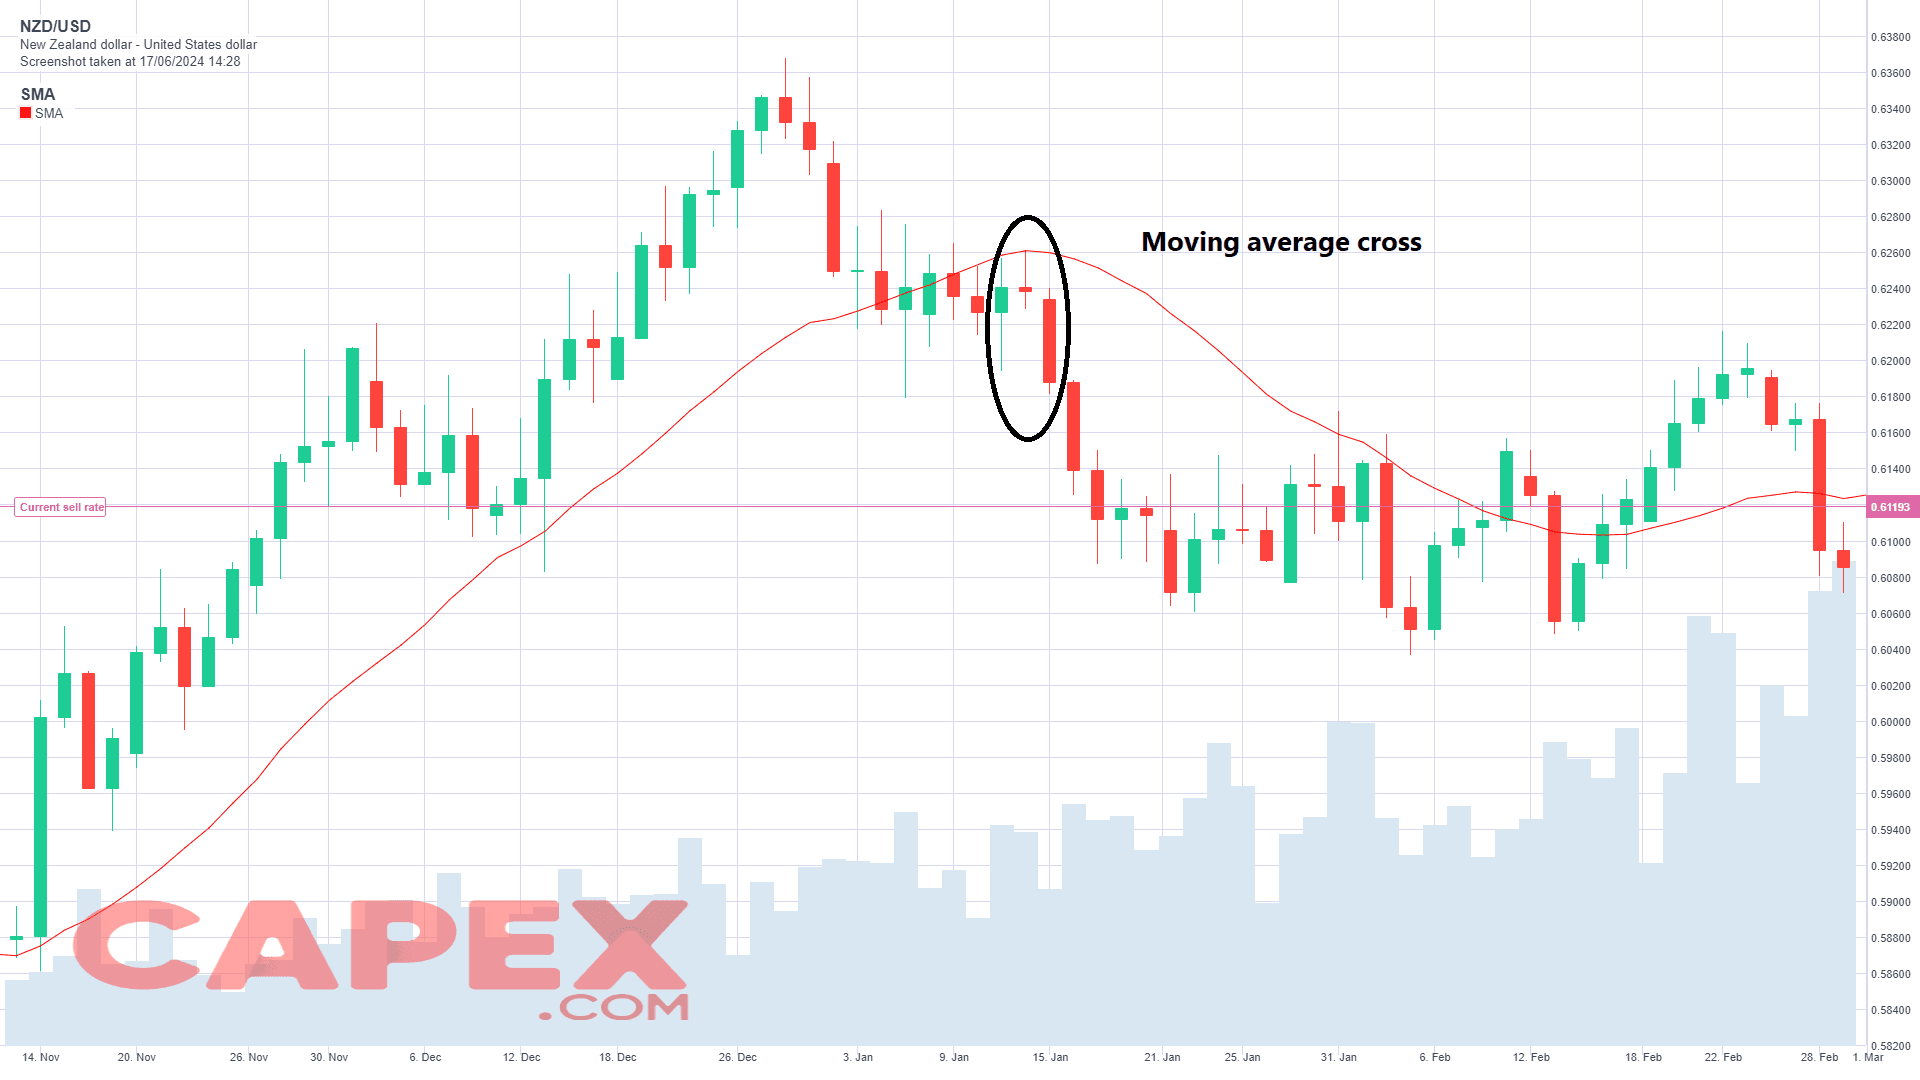
Trading Evening Star pattern with Moving Averages
Moving averages serve as valuable tools for technical analysts seeking medium-term trading opportunities, with their crossovers offering predictive indicators of future trends. In the chart of the NZD/USD pair below, the price exhibited a modest upward movement towards the moving average, coinciding with the presence of the evening star candlestick pattern touching the moving average. This configuration typically signals a selling pattern for technical traders, who await confirmation signals indicating a potential downtrend.
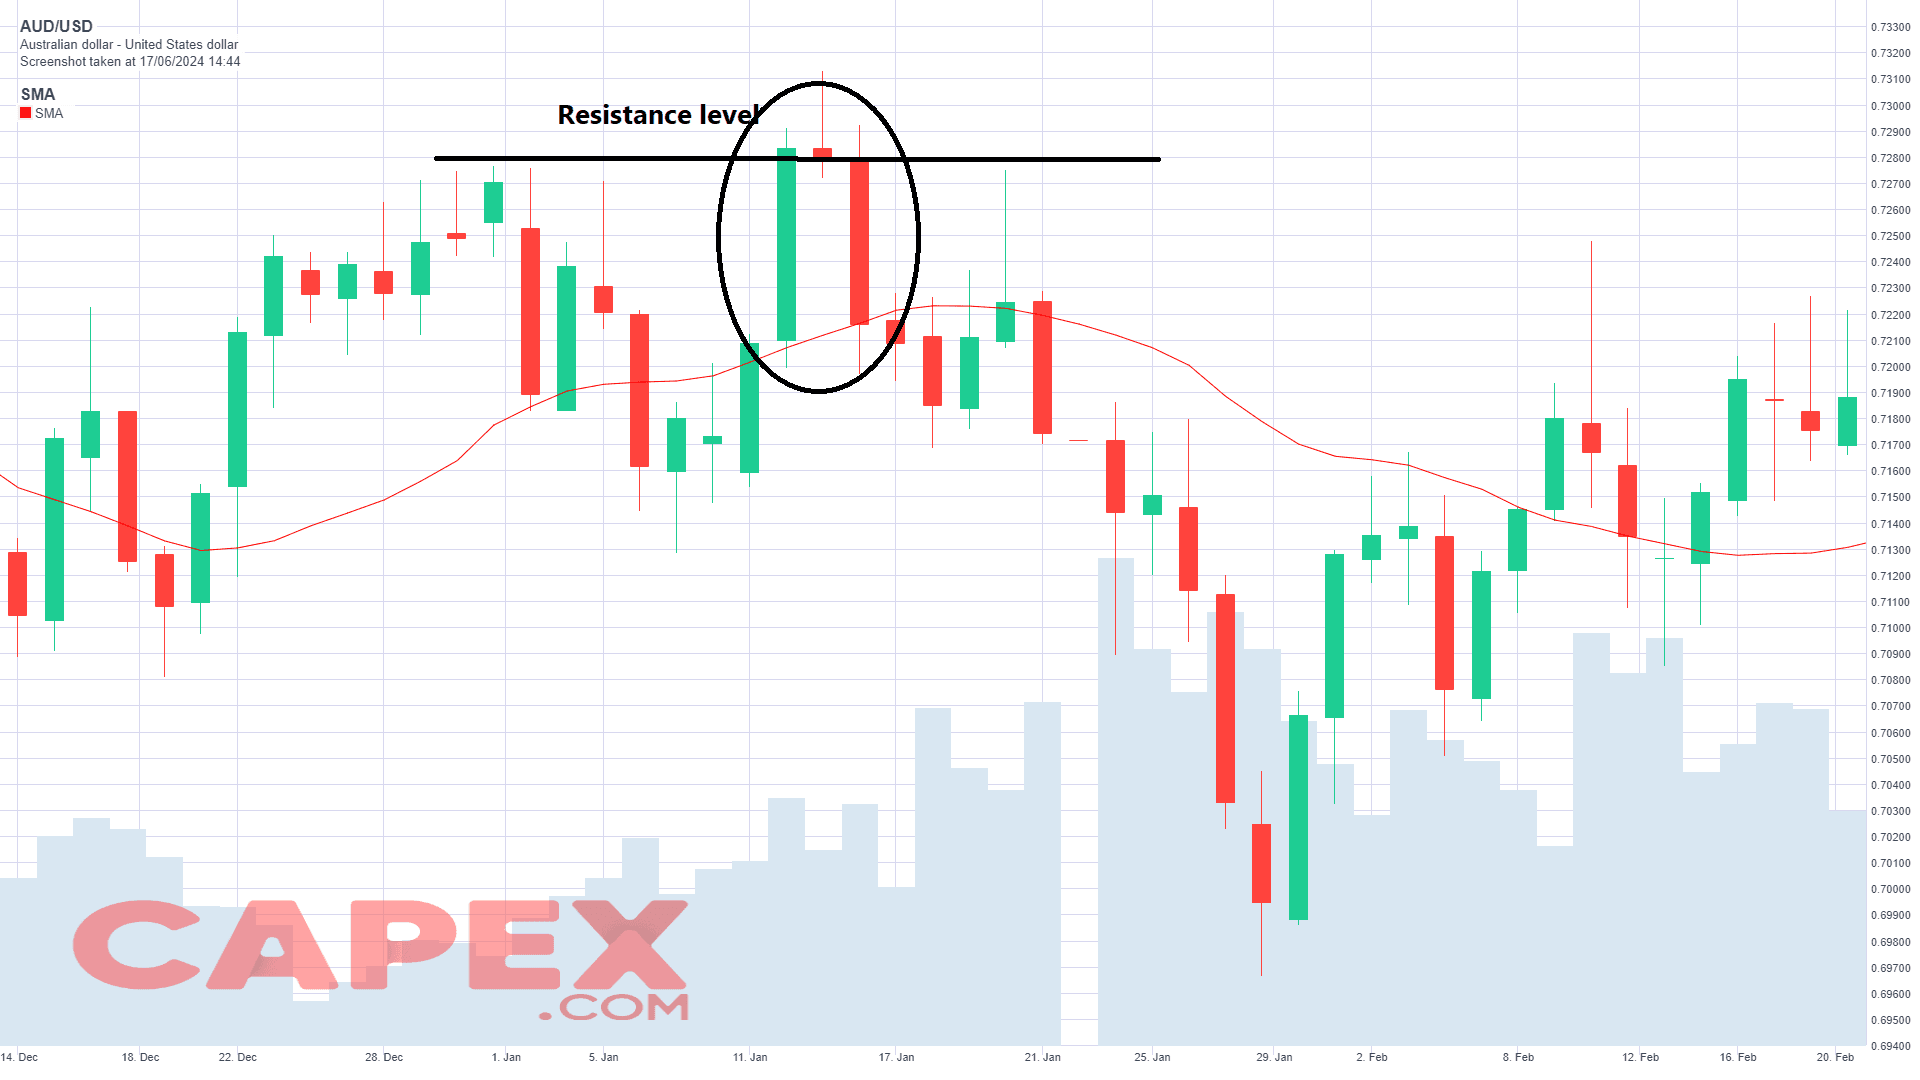
Trading Evening Star pattern with Resistance Levels
Support and resistance levels refer to price levels where market movements have been repeatedly halted, preventing further upward or downward movement. These levels are depicted as lines on a chart, with support indicating where buying pressure prevents prices from falling further, and resistance indicating where selling pressure prevents prices from rising.
In the AUD/USD chart below, the Evening Star candlestick pattern appears at a resistance level, suggesting a potential bearish trend reversal. This pattern is recognized by technical traders as a signal to sell, indicating that the market momentum might shift downwards from this resistance barrier.
Advantages and disadvantages of Evening Star pattern candle
Since Evening Star candles have advantages and disadvantages, traders should avoid entering a trade immediately after spotting a Evening Star candle. Or unless it is as a trend confirmation signal.
Advantages
- Provides a clear visual indication of an impending shift in price momentum towards bearish territory.
- Is applicable across diverse financial markets and timeframes.
- Assists traders in pinpointing potential sell points or exits from long positions.
- Presents distinct candlestick patterns with specific structures, facilitating straightforward identification.
- Can enhance trade accuracy when combined with supplementary technical tools and indicators, increasing the likelihood of profitable trades.
Disadvantages
- The pattern's relatively infrequent appearance reduces its frequency of use.
- Relying solely on false signals could lead to potential losses.
- Achieving higher accuracy necessitates confirmation through additional technical indicators or analysis.
- Effectiveness can vary depending on market conditions and the overall trend.
- Traders should base decisions on robust risk management principles rather than relying solely on the pattern.
Final notes about Evening Star Candlestick
The Evening Star candlestick pattern stands out as a prominent bearish reversal signal for traders looking to identify potential shifts in market trends. Understanding its characteristics, using it alongside other technical tools, and acknowledging its pros and cons are essential for traders aiming to enhance their trading outcomes.
Traders utilize the Evening Star pattern to detect potential reversals in bearish price trends, providing a clear visual indication that upward momentum may be diminishing, and a bearish sentiment could be emerging. It's important to be mindful of the pattern's rarity and the risk of false signals.
Therefore, integrating the Evening Star pattern with additional technical indicators and robust risk management strategies is crucial for a comprehensive trading approach. By adopting these practices, traders can improve their decision-making processes and mitigate potential risks effectively.
Free resources
Remember, you should have some trading experience and knowledge before you decide to trade with Evening Star candlestick pattern, you should consider using the educational resources we offer like CAPEX Academy or a demo trading account. CAPEX Academy has lots of free trading courses for you to choose from, and they all tackle a different financial concept or process – like the basics of analyses – to help you to become a better trader or make more-informed investment decisions.
Our demo account is a suitable place for you to get an intimate understanding of how trading and investing work – as well as what it’s like to trade with leverage – before risking real capital. For this reason, a demo account with us is a great tool for investors who are looking to make a transition to leveraged securities.
Sources:
- https://candlecharts.com/
- https://www.cfainstitute.org/en/membership/professional-development/refresher-readings/technical-analysis
- https://www.cmegroup.com/education/courses/technical-analysis/chart-types-candlestick-line-bar.html