


Gold Technical Analysis
- XAU/USD trend changes from neutral to bearish
- Bearish momentum may accelerate below $1,861
Bulls Pullback
On September 16, Gold rallied to an over two-week high at $1,973 then retreated after as bulls seemed to cut back. Ultimately, a weekly candlestick closed with a Doji pattern highlighting the market indecision. The Relative Strength Index (RSI) remained flat then crossed below 50 on Monday signaling a possible start of bearish momentum.
Gold Daily Price Chart (August 6 – September 23, 2020)

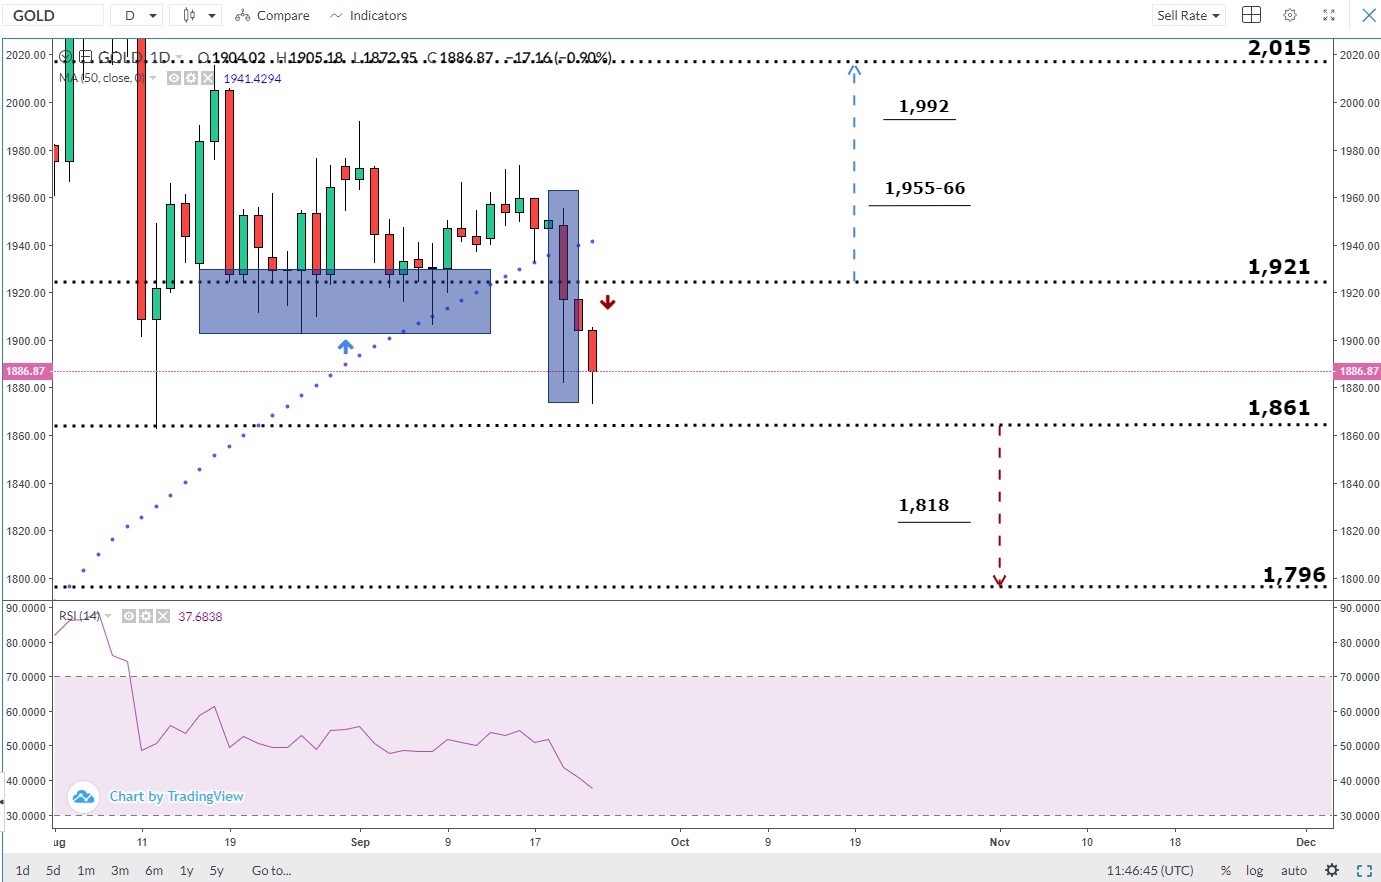
Chart source, Webtrader, Capex.com
On Monday, Gold slipped by 1.7% and closed below the 50-day moving average. The precious metal moved to the lower trading zone $1,861- $1,921 eyeing a test of the low end of it.
A daily close below the low end of the zone could encourage bears to press towards the monthly support at $1,796 (Oct 2012 high).
On the other hand, a failure to close below the low end of the zone at $1,861 could reverse the current direction towards the high end of the zone.
Would you like to trade on live oil prices with a CySEC regulated broker? Open an account
Gold Four Hour Price Chart (September 8 – September 23, 2020)
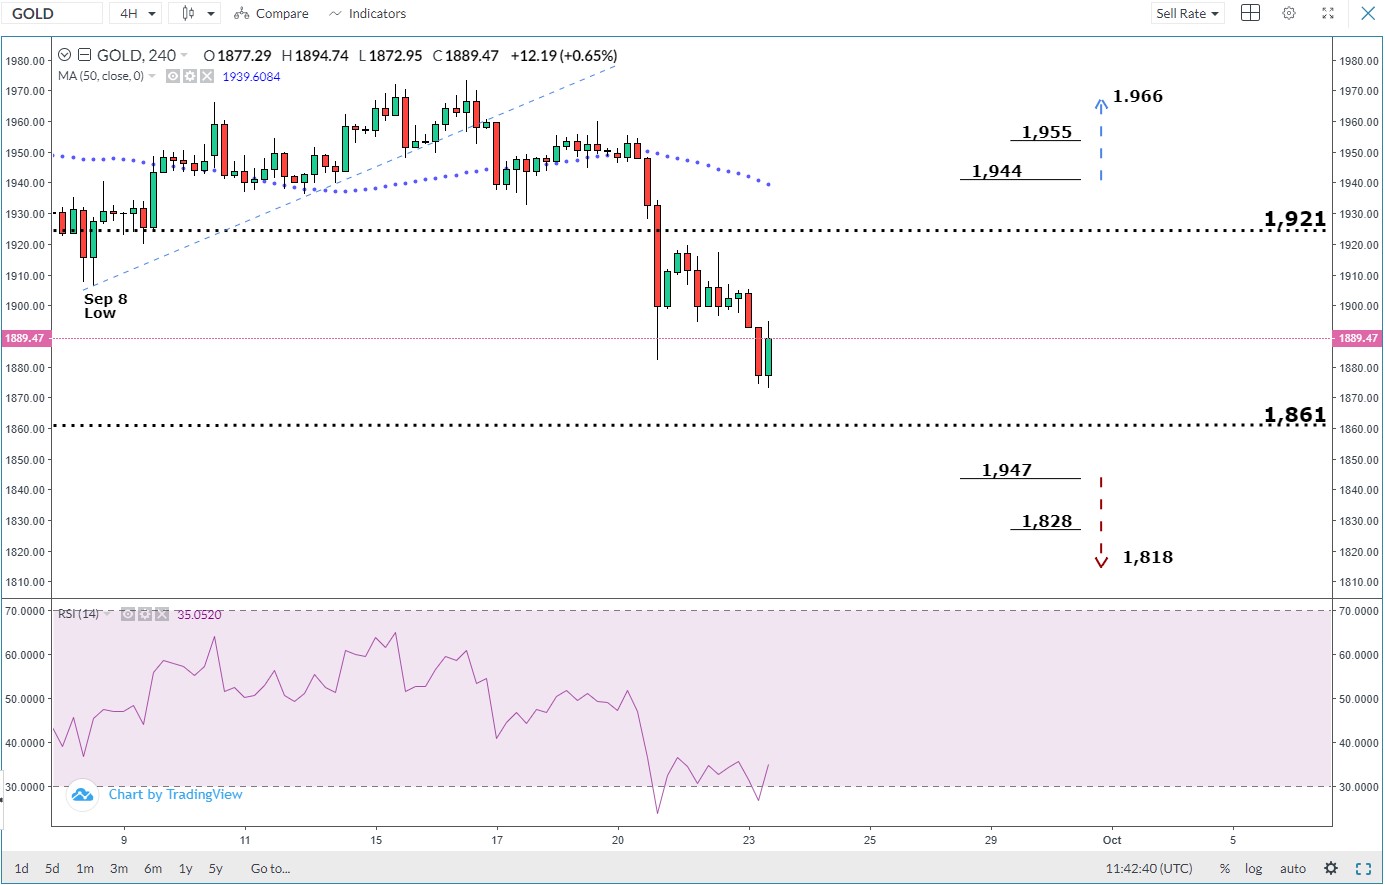
Chart source, Webtrader, Capex.com
Last week, Gold traded below the bullish trendline support originated from the Sep 8 low at $1,906 and started a downward trend creating lower highs with lower lows.
To conclude, while the negative bias is still in place a break below $1,847 could send XAU/USD towards $1,818 while a break above $1,944 may trigger a rally towards $1,966. As such, the support and resistance levels underscored on the chart should be monitored closely.

