


This figure confirms the high degree of recovery of the British economy thanks to the success rate of vaccines administration, allowing for restrictions to end and life to return to normal.
U.K.’s Retail Sales data contrasts with Germany’s Manufacturing PMI report for May, which failed to meet expectations showing a figure of 64.0, down from 66.2.
This difference in both expectations and economic data between the United Kingdom and Europe could lead to different behaviours of their respective central banks regarding monetary policy decisions.
While the Bank of England has already spoken openly about the need to initiate the reduction process in its asset purchase program, the European Central Bank appears to be far away from such a moment. In addition, the ECB faces the danger of rising U.S. Bonds Yields, which could drag their European counterparts up, something that it will try to avoid at all costs with its bond purchases.
Consequently, the difference in interest rates between the United Kingdom and Europe will widen in favour of the British, which is one of the main factors affecting the Euro price.
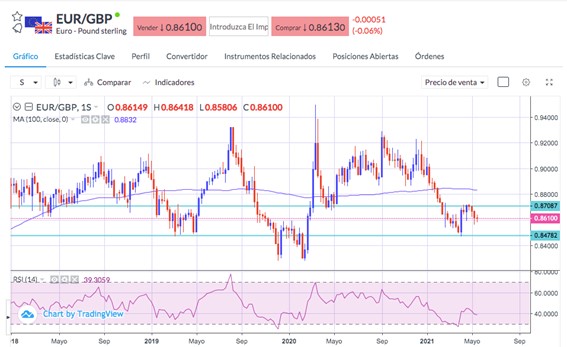
The British pound has had a positive performance so far this year. If the scenario described above occurs, this upward trend will probably continue, especially against the euro.
The EUR/GBP pair shows us that after an upward correction of the main downward trend, which began earlier this year, it has a resistance level at around 0.8700 and main support at 0.8478. Below this level, it would make its way to lower targets around the 0.8300 zone.

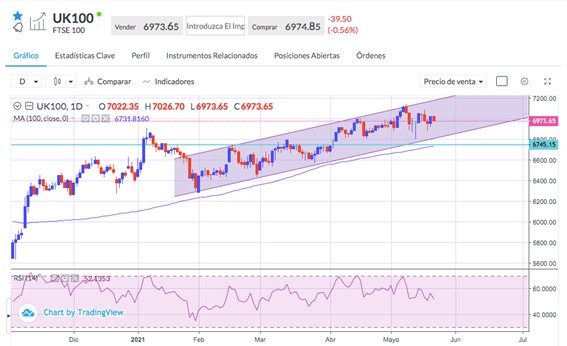
This better performance of the British economy, with optimistic expectations about its evolution in the short and medium-term from most market analysts, is reflected in the performance of the British FTSE 100 index.
In the daily chart, we observe a well-defined bullish channel that is still active without signs of exhaustion. The RSI is in the zone still below the overbought levels, with a support and pivot level below the bullish channel and marked by the 100-day line SMA that is now located in the 6745 area, still far from the current trading levels.
Sources: F.T., WSJ.

