


Several OPEC+ members expressed their beliefs that demand for crude would decrease in the coming months due to the rising COVID-19 cases, suggesting it would be the right time to reduce production. However, Russia dispelled all doubts about the OPEC+ agreement, saying that the global demand for crude increased and even showed their willingness to increase output further if required.
Following these statements, oil fell to $67.12/barrel. But as soon as the International Energy Agency’s report came out, it completely reversed this downward trend, as data showed an increase of up to 23 million barrels per day.
This rise in demand comes mainly from the greater use of automobiles and the rebound in purchases by China, which aroused concern in the market due to the slowdown of leading Asian indicators. In addition to all this, the crude inventory data plummeted to -7.1 M compared to the -3.0 M expected.

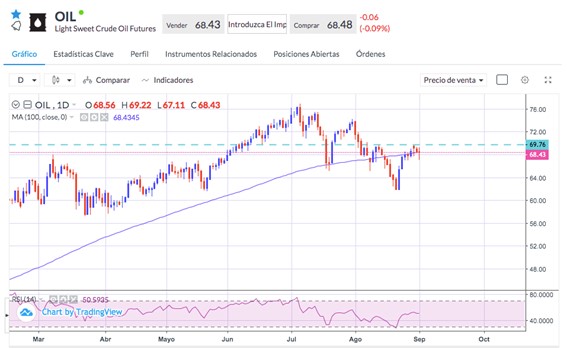
At the end of the trading day, crude oil closed practically unchanged but was still technically below the resistance zone, located around $69.76.
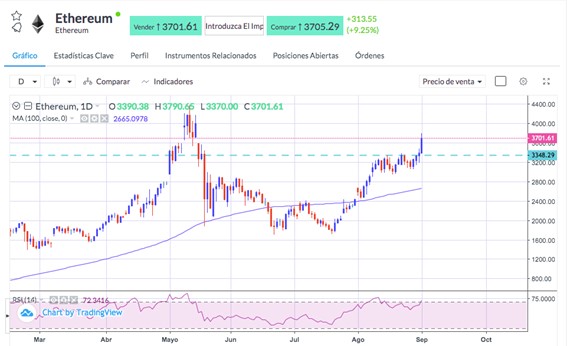
In the crypto world, there were also movements exciting developments. Ether rose strongly in the late afternoon, with gains of more than $200, increasing its value by 10%. On the other hand, Bitcoin only added a little over 3%.
The Ether's surge was primarily due to the increase in NFTs interest (non-fungibles tokens). NFT sales are generally settled in Ether, creating demand from buyers as NFT prices continue to rise and spread.
Technically, Ethereum has broken up a critical resistance level located at the $3348 area and does not find any other relevant resistance up to the highs of $4382. Investors now keep their eyes on the RSI indicator, which is at overbought levels on the daily chart. Any downward correction from current prices could create bearish divergences in the indicator.
Sources: Bloomberg, reuters.com.

