


Key Data Releases in the Week ahead
On Monday, November 23, the market expects the Eurozone, the UK, and the US PMI numbers (Flash) of November, and the Fed member Daly speech.
On Tuesday, November 24, investors will focus on the German GDP (Q3) final read and the Ifo business climate number of November, the ECB President Lagarde’s speech, the US consumer confidence figure of November, and Fed members Bullard, Williams, and Clarida will speak respectively.
On Wednesday, November 25, markets will follow the US GDP (Q3) with durable goods orders of October, the continuing jobless claims, and PCE Price index number of October. Later on, traders will find out about the US oil inventories change and will check the FOMC minute.
On Thursday, November 26, eyes will be on the German GfK consumer confidence number of December, and the ECB Monetary policy meeting accounts.
On Friday, November 27, markets will check the UK housing Price index of November, the Eurozone consumer price index of November.
Looking for a regulated company? Open now a trading account with Capex.com
Dow Jones - Daily Price Chart (September 8 – November 22, 2020)

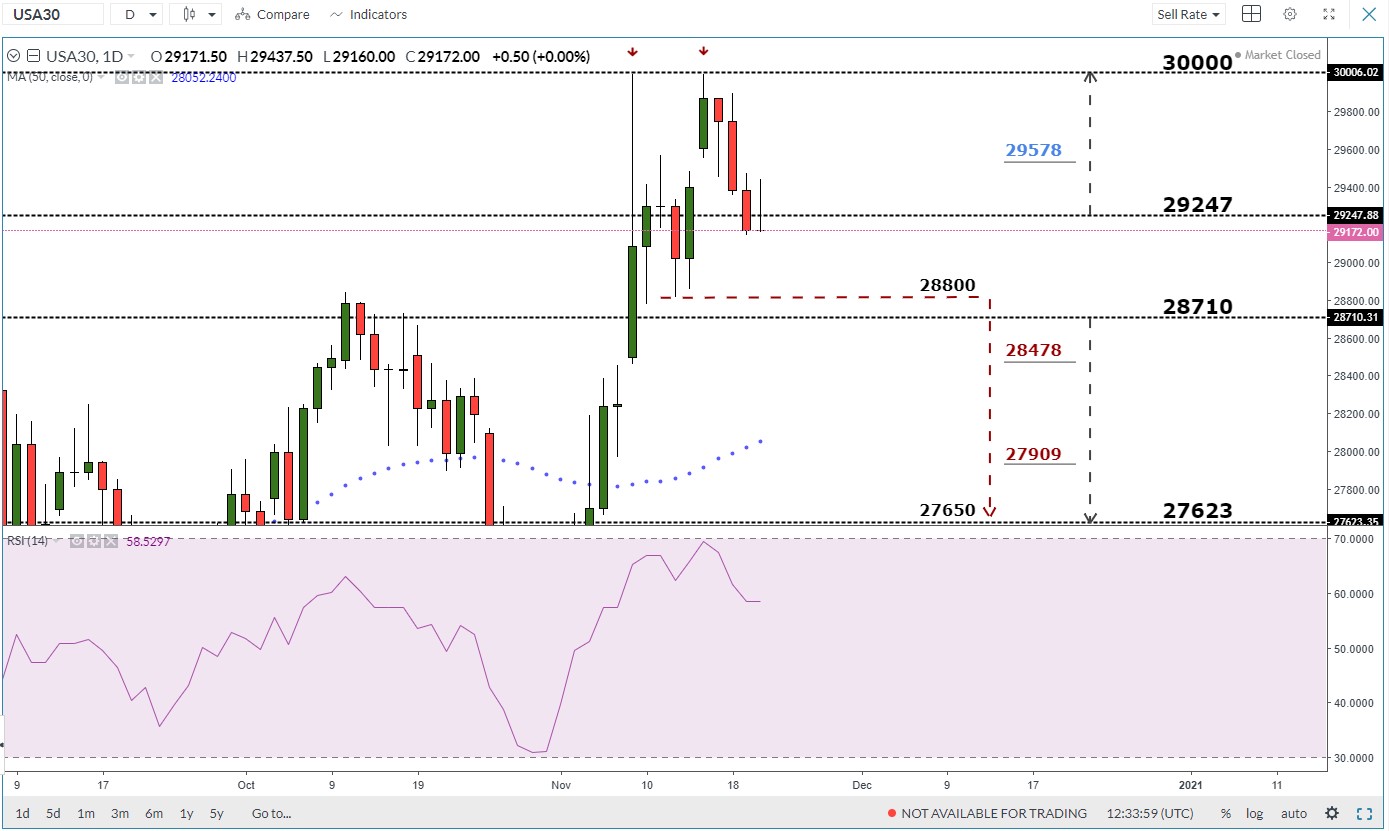
Last week, the Dow Jones hit an all-time high at 29996 then reversed lower reflecting that the upward trend was losing momentum. On Thursday, the price retreated to the current 28710 – 29247 trading zone. It is worth noting that, the market developed a double top pattern where the neckline resides 28800, a break below that level could send the price even lower towards 27650.
A daily close below the low end of the trading zone at 28710 highlights even weaker bullish momentum and could send the Dow Jones for a test of the weekly support level at 27623.
On the other hand, a daily close above the high end of the zone 29247 may encourage bulls to rally the price for a test of the key psychological level at 30000.
Dow Jones - Four Hour Price Chart (November 6 – November 22, 2020)

On November 18, the Dow Jones traded below the bullish trendline originated from the November 6 low at 27966 and generated a bearish signal which thus far held.
In conclusion, while bullish momentum shows signs of weakness a break below the neckline of the double top pattern discussed above at the daily chart could reverse the price direction. Thus, a break below 28478 could send the price even lower towards 27909. On the flip side, a break above 29470 may cause a rally towards 29753. As such, the support and resistance levels underlined on the chart should be watched closely.

