
")


Oil Price Technical Overview
- Oil Price nears a nine-month high
- Positive outlook while above $46.47 for the Brent oil and $43.80 for the US Oil
The Oil price rallied further on Wednesday on increasing optimism of better global demand in 2021 thanks to the coronavirus vaccines’ breakthrough combined with expectations that OPEC+ would delay an increase in production planned for January next year.
Brent Oil Daily Price Chart (Feb 19 -November 25, 2020)

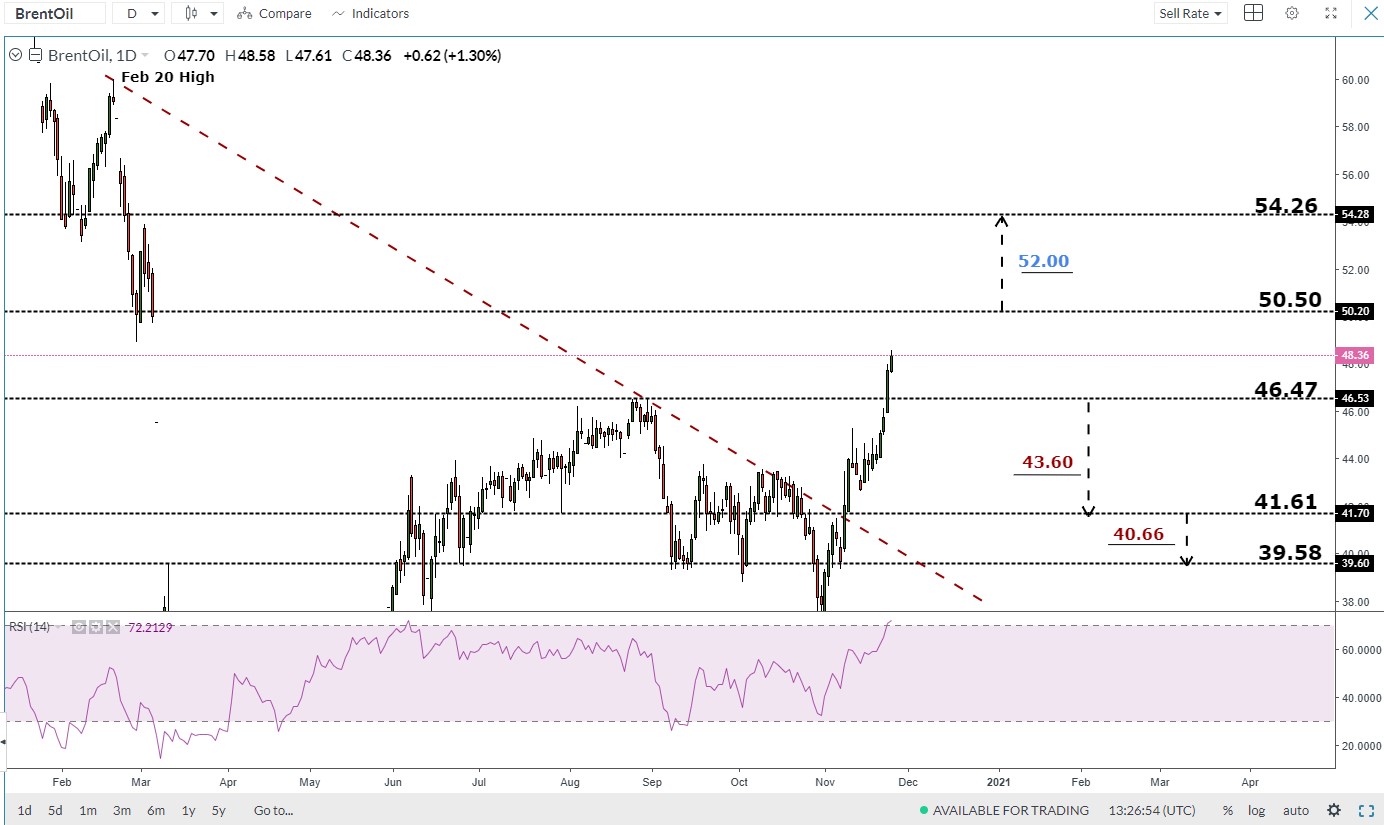
On November 9, the Brent oil broke above the slopping bearish trendline originated from the February 20 high at 59.99 highlighting a shift in favor of the bull’s control. Yesterday, the price climbed to a higher trading zone $46.47 - $50.50 and the Relative Strength Index (RSI) rose to overbought territory emphasizing the strength of the bullish momentum.
A daily close above the high end of the zone at $50.50 may trigger a rally towards the monthly resistance level at $54.26.
On the flip side, a failure in closing above the high end of the zone could reverse the price’s direction towards the low end of the zone at $46.47. A further close below that level could send the price even lower towards the weekly support level at $41.60.
As such, the support and resistance levels underlined on the chart should be watched closely.
Would you like to trade on live oil prices with a regulated broker? Open an account
US Oil Daily Price Chart (January 20 - November 25, 2020)
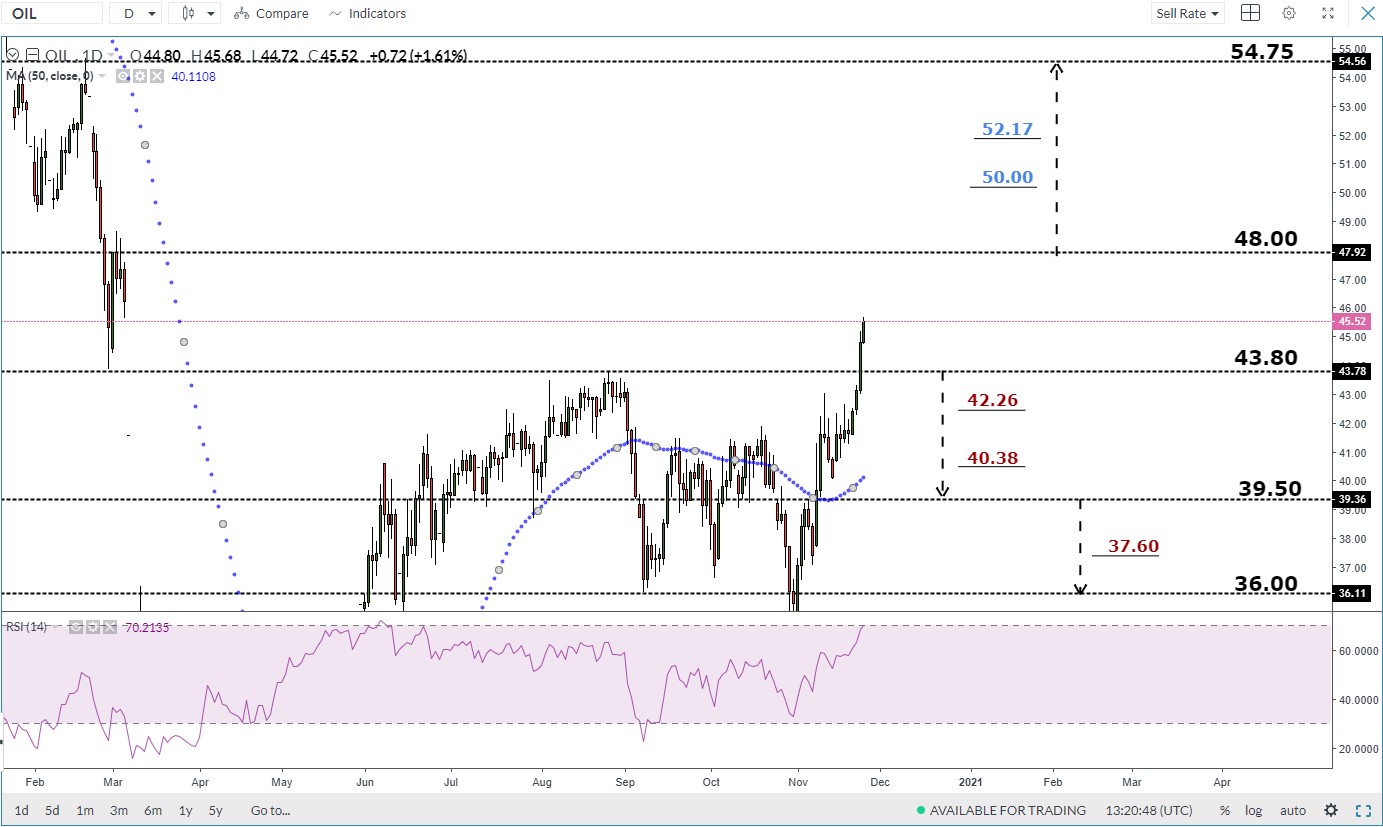
Yesterday, bulls took charge and pushed the US Oil rallied to a higher trading zone $43.80 - $48.00.
A daily close above the high end of the zone at $48.00 may encourage bulls to extend the rally towards the monthly resistance level at $54.57.
On the other hand, a failure in closing above the high end could reverse the price direction towards the low end of the zone at $43.80. A further close below that level could mean more bearishness towards $39.50.
As such, the support and resistance levels underlined on the chart should be watched closely.

