


Candlestick patterns are essential for identifying potential price reversals and continuations in technical analysis. Today, we'll explore one of the most important patterns: the Morning Star Candlestick Pattern.
Have you ever witnessed the transition from night to day at sunrise? In trading, the morning star operates similarly, symbolizing a shift in market momentum. Candlesticks on a chart aren't mere symbols; they narrate a story of market sentiment change.
As a Japanese reversal candlestick, the morning star pattern is pivotal signaling an imminent bullish reversal amid a downtrend. It signifies more than just price adjustments; it reflects a shift in market sentiment.
The morning star candlestick pattern equips traders with crucial insights amidst market volatility, suggesting diminishing bearish influence and growing bullish momentum.
Morning Star Candlestick Pattern - How to use this guide
- To get the most out of this guide, it’s recommended to practice putting these Morning Star candle trading strategies into action.
- The best risk-free way to test these strategies is with a demo account, which gives you access to our trading platform and $50,000 in virtual funds for you to practice with.
- Once you’ve found a strategy that consistently delivers positive results, it’s time to upgrade to a fully funded live account where you can apply your newfound edge.
What is a Morning Star Candlestick?
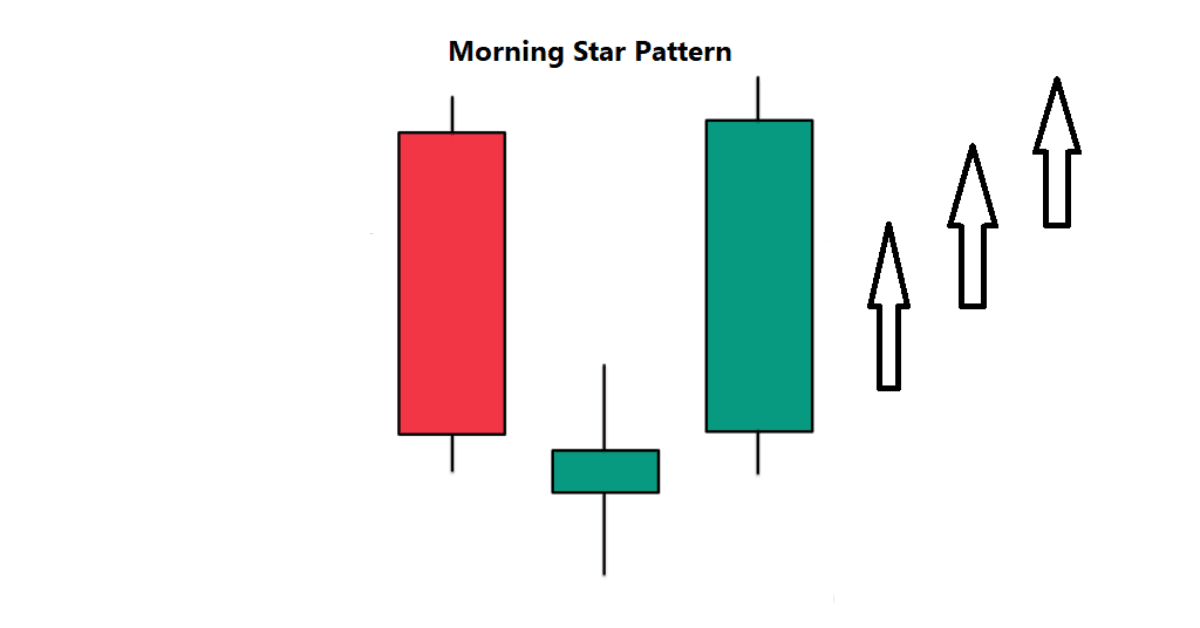
The morning star candlestick pattern signifies a potential shift in direction from bearish to bullish. It typically appears at the end of a downtrend, suggesting a reversal in an asset's price trajectory.
Comprising three candles, the pattern begins with a long, red bearish candle that extends the prevailing downward movement. Next, a small candle, whether green or red, indicates a pause in the downtrend's momentum. Finally, a long green bullish candle completes the pattern by opening above the midpoint of the preceding candle, indicating renewed buying pressure.
This sequence of candles reflects diminishing selling pressure as bullish sentiment gains traction. The strong bullish candle validates increasing investor confidence, while the middle candle marks a period of indecision following the downtrend. Traders often see this pattern as a potential entry point for participating in a new uptrend.

The reliability of any reversal signal hinges on established factors such as momentum indicators and trading volume. Nonetheless, traders can capitalize on opportunities presented by this pattern at market bottoms. When identified on a charts patterns, the morning star pattern signals to market participants the potential end of a downtrend and the likelihood of a forthcoming bullish reversal.
Familiarizing oneself with how to identify this pattern is essential for navigating asset charts effectively. Let's discover how to recognize the star pattern in the morning.
How is a Morning Star candlestick formed?
The morning star pattern on a candlestick chart consists of three candles. The first candle has a long body, indicating that the closing price is lower than the opening price, indicating a significant price decline. This bearish candle indicates that the price of the asset is heading down.
To identify a Morning Star pattern, consider the following factors:
- Previous downtrend: The morning star pattern usually appears near the bottom of a downtrend, indicating a possible reversal.
- Candlestick formation: The pattern consists of three candlesticks. The first is a large bearish candle (red), reflecting strong selling pressure. The second candle is smaller and can be bullish, bearish or doji, which represents indecision. If the second candle is bullish, this indicates a stronger reversal signal.
- Gap: The second candle of the second day begins with a bearish gap down, indicating initial control by the bears. However, they fail to reduce prices significantly.
- Bullish candle: The third and most important candle (Day 3) opens with a gap up. Bulls take control and push prices higher, often erasing gains from day one.
Compared to candle shadows, candle bodies have more important characteristics. The lines above and below the candle body, called shadows, represent the highest and lowest prices during a specific period of time.
A longer shadow indicates more price variation. Analysts prioritize the open and close prices on the day's trading range when determining the morning star pattern.
Morning star vs Evening star
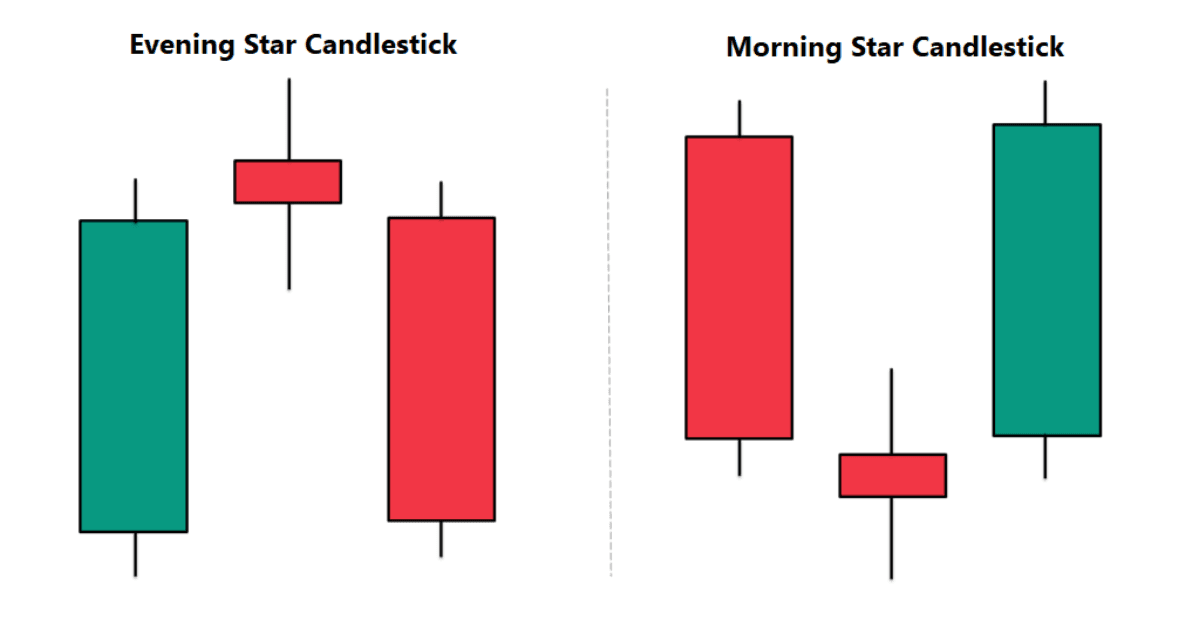
Technical analysts employ the Morning Star and Evening Star candlestick patterns to signal potential reversals in price trends, each displaying distinct characteristics.
At the peak of an uptrend, the Evening Star pattern appears, indicating a potential shift to bearish momentum. This pattern consists of a long bullish candle, a small or neutral "star" candle, and a subsequent bearish confirmation candle. It suggests waning buying pressure and a possible takeover by sellers, likely pushing prices lower.
Conversely, the Morning Star pattern emerges at the bottom of a downtrend, signaling a potential bullish reversal. It comprises a long bearish candle, a small or neutral "star" candle, and a bullish confirmation candle. This pattern indicates reduced selling pressure and the potential for buyers to regain control, potentially driving prices higher.
While the Morning Star indicates a bullish reversal and the Evening Star signals a bearish reversal, there are several other star patterns that assist traders in determining optimal buying or selling opportunities.
Although the efficacy of technical analysis as an investment strategy remains debated, traders and analysts rely on these patterns to identify potential entry and exit points and make informed trading decisions.
What sets a Morning Star Candlestick apart from a Morning Star Doji Candlestick?

Traders often search for signs of market indecision, characterized by a reduction in selling pressure and a flattening of market movements. This is where Doji candles come into play, observed when the market opens and closes around the same level or very close to it. Such candles signify a temporary pause in the trend, prompting bullish sentiment as buyers perceive value and prevent further downward movement. The bullish signal is confirmed by the subsequent appearance of a bullish candle following the Doji candle.
The primary distinction between a Morning Star and a Morning Star Doji candlestick pattern lies in the middle candlestick. In a typical Morning Star pattern, the middle candlestick is a short red body that gaps down from the preceding long red candlestick, indicating continued selling pressure. In contrast, the middle candlestick in a Morning Star Doji pattern forms a Doji star with little to no real body.
This Doji star reflects market hesitation and uncertainty following a decline. While both patterns signal potential reversals after downward trends, the Doji version requires confirmation from subsequent bullish candles due to its higher level of uncertainty.
How to trade Morning Star candlesticks
If you wish to trade after spotting a Morning Star pattern, you can use derivatives like CFDs. With derivatives, you can trade both rising and falling prices. Therefore, you can open a long position based on your prediction of the asset's price movement when a Morning Star pattern appears.
Follow these steps to trade Morning Star pattern:
- Identify the pattern. When a Morning star pattern is forming, look for a downtrend, as this may indicate a potential trend reversal.
- Verify the pattern. Wait for more bullish candlestick patterns or other technical indicators (such as support levels or trend lines) that confirm a bullish reversal to increase the reliability of the signal.
- Set a stop loss. Place a stop loss order above the lowest point of the pattern to minimize potential losses if a trend reversal does not materialize.
- Take a long position and monitor the trade. Enter a long trade expecting the price to rise once the pattern is confirmed and a stop loss is set. Monitor price action and adjust take profit and stop loss levels as necessary.
Trading Strategies with Morning Star Candlestick
Below we explore various Morning Star candle strategies that can be applied to trading.
Trade the Morning star pattern with uptrend on the charts
A chart pattern is a shape within a price chart that indicates possible future price movements based on historical data. Chart patterns are fundamental to technical analysis and require traders to know exactly what to look for.
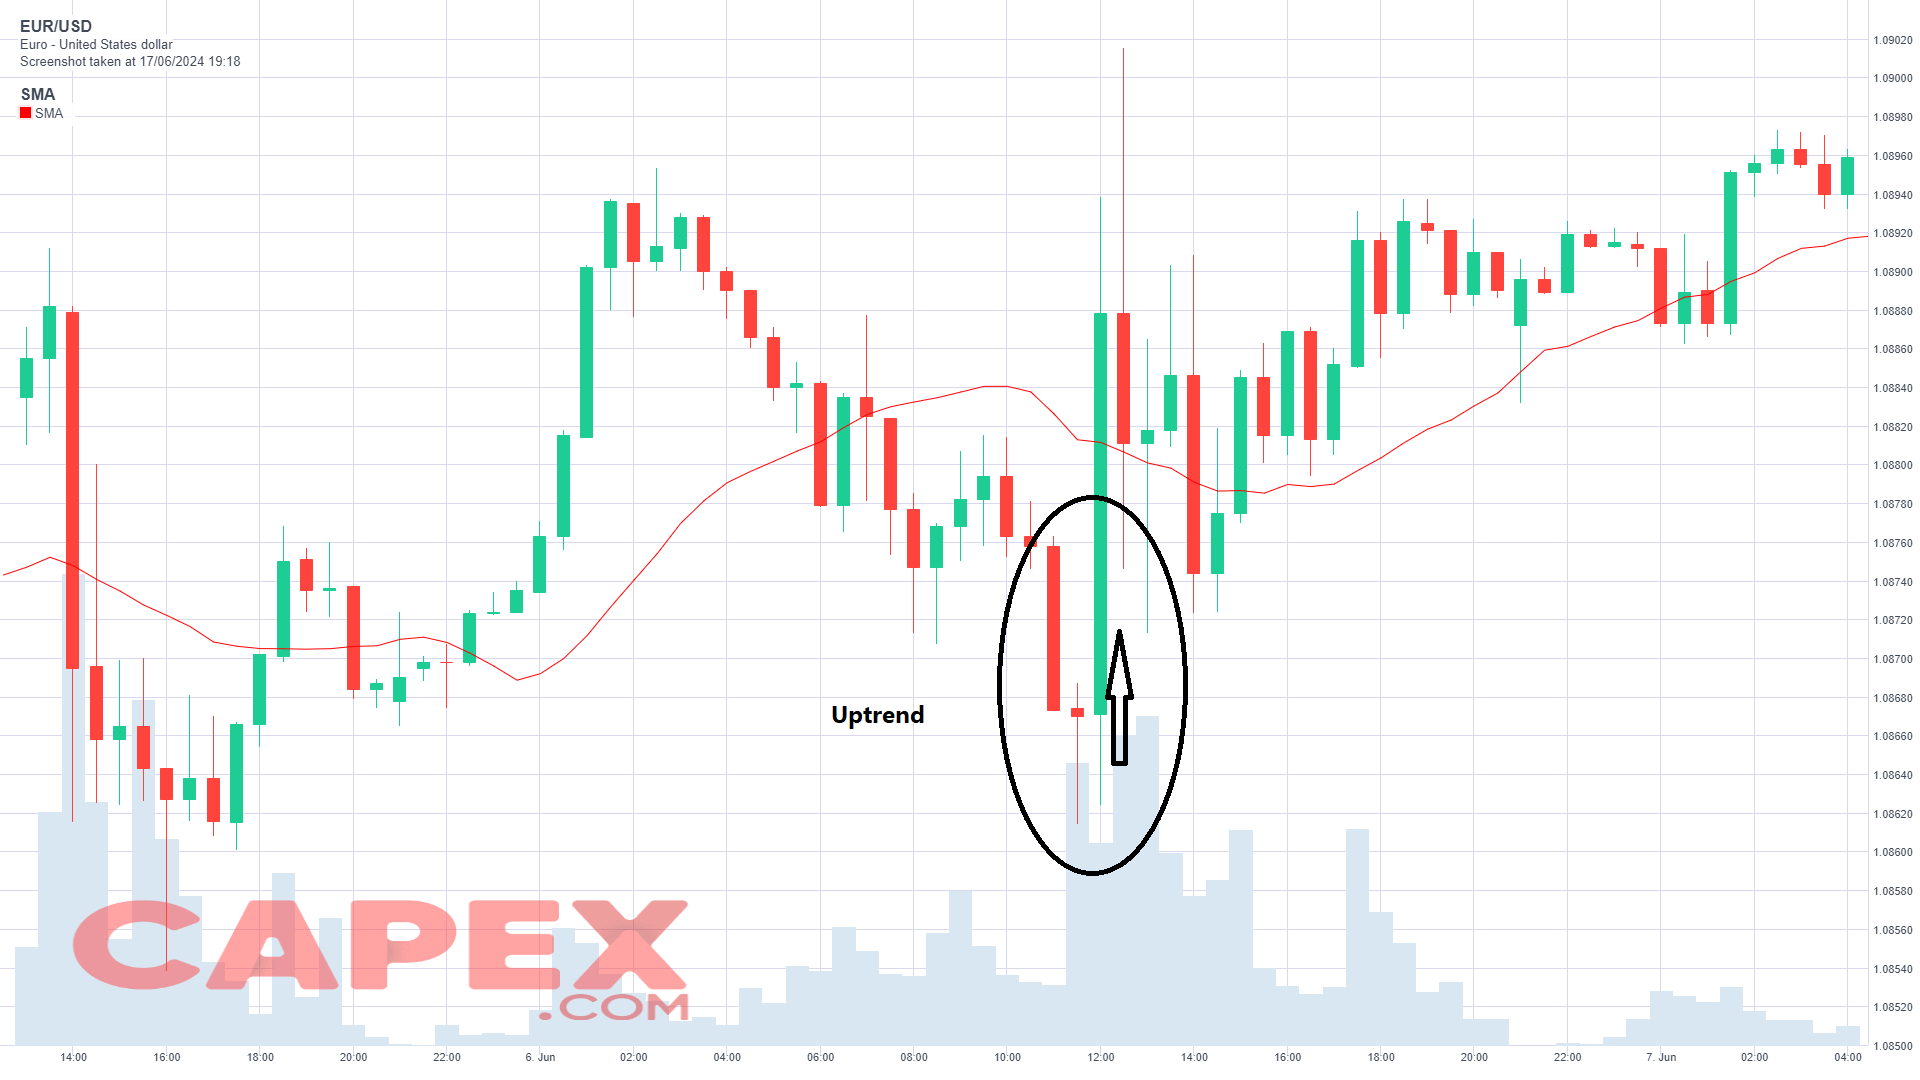
The chart above for EUR/USD shows a morning star candlestick pattern that appears during a general uptrend. Given that the Morning Star is a bullish reversal pattern, its appearance within an uptrend signal to traders a potential continuation of the uptrend.
Trading Morning Star pattern with Moving Averages
Moving averages serve as valuable tools for technical analysts looking for medium-term trading opportunities, as their crossovers provide predictive indicators of future trends.
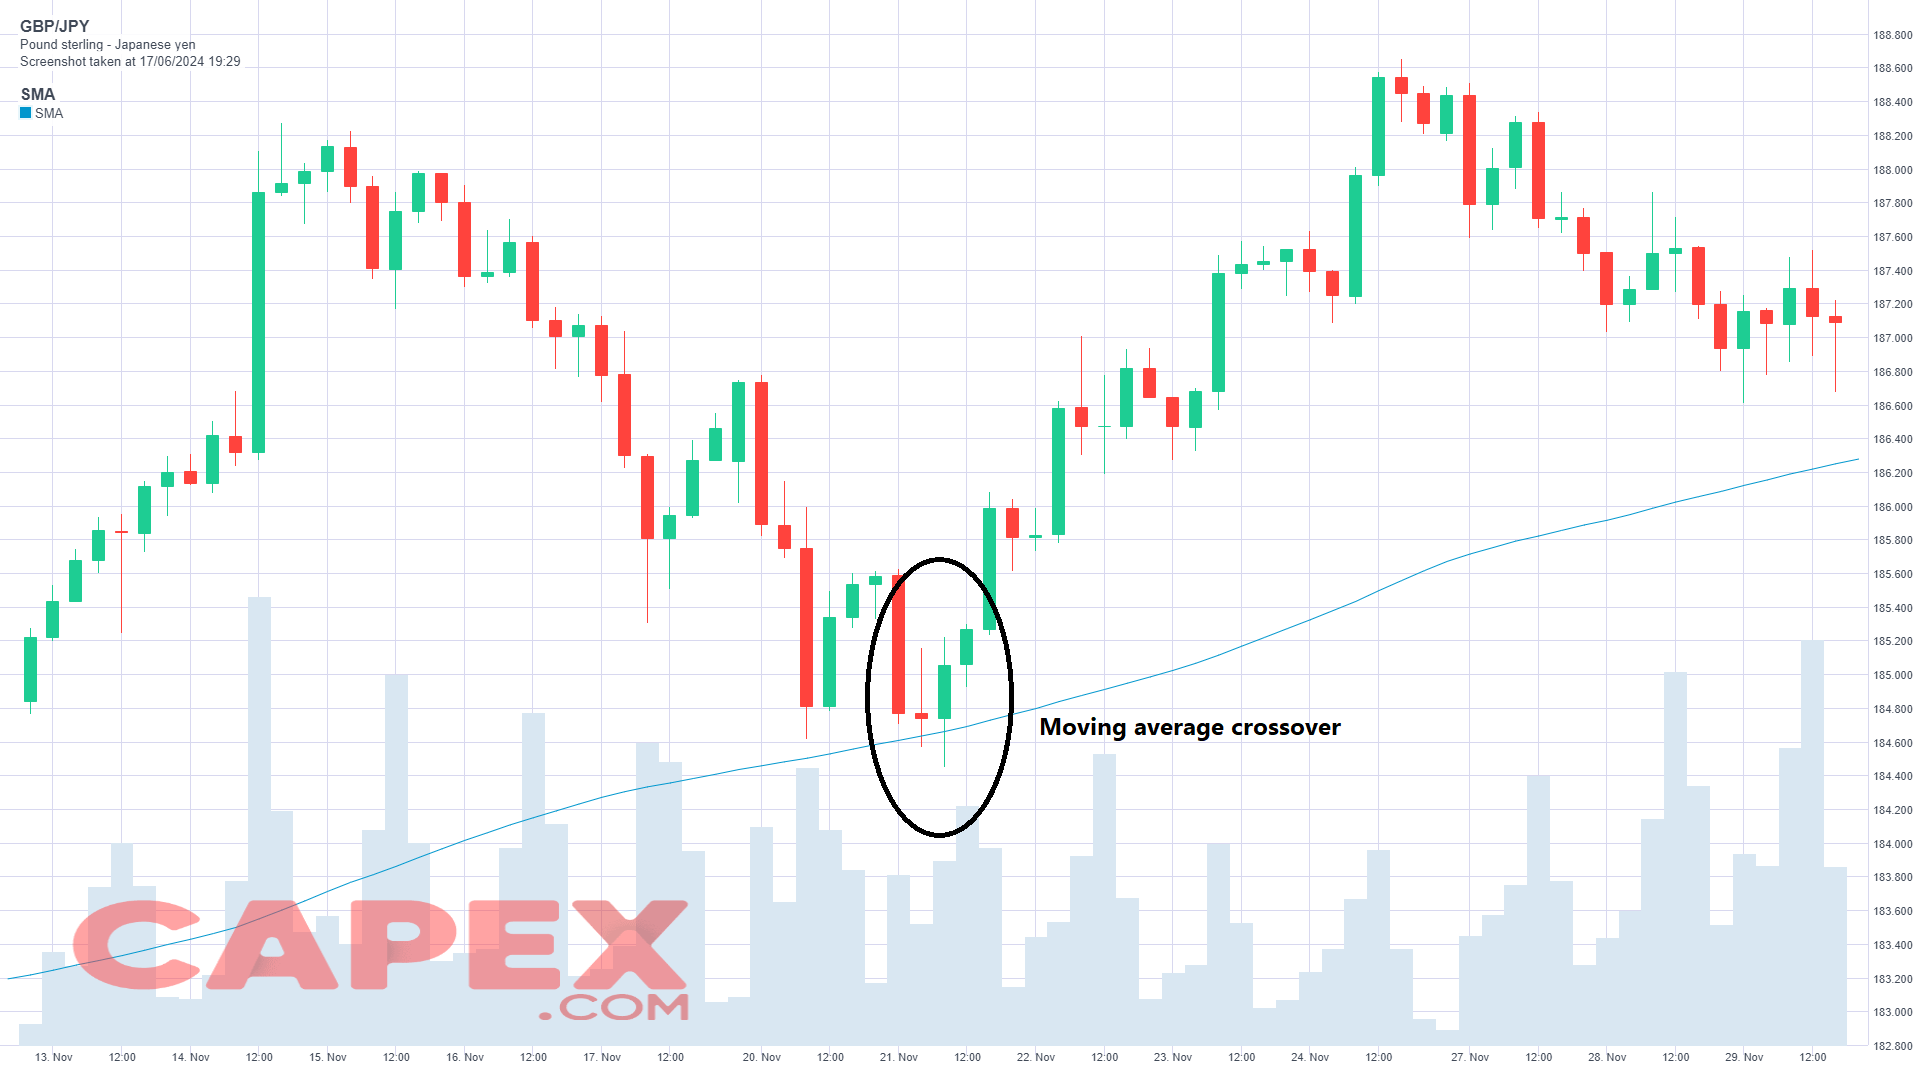
On the GBP/JPY chart above, the price showed a modest downward movement towards the moving average, coinciding with a morning star pattern touching the moving average. This formation usually indicates a buying pattern for technical traders, who are waiting for confirmation signals that indicate a potential uptrend.
Trading Morning Star pattern with Support Levels
Support and resistance levels refer to price levels where market movements have repeatedly stopped, preventing further upward or downward movement. These levels are depicted as lines on a chart, where support indicates where buying pressure is preventing prices from falling further, and resistance indicates where selling pressure is preventing prices from rising.
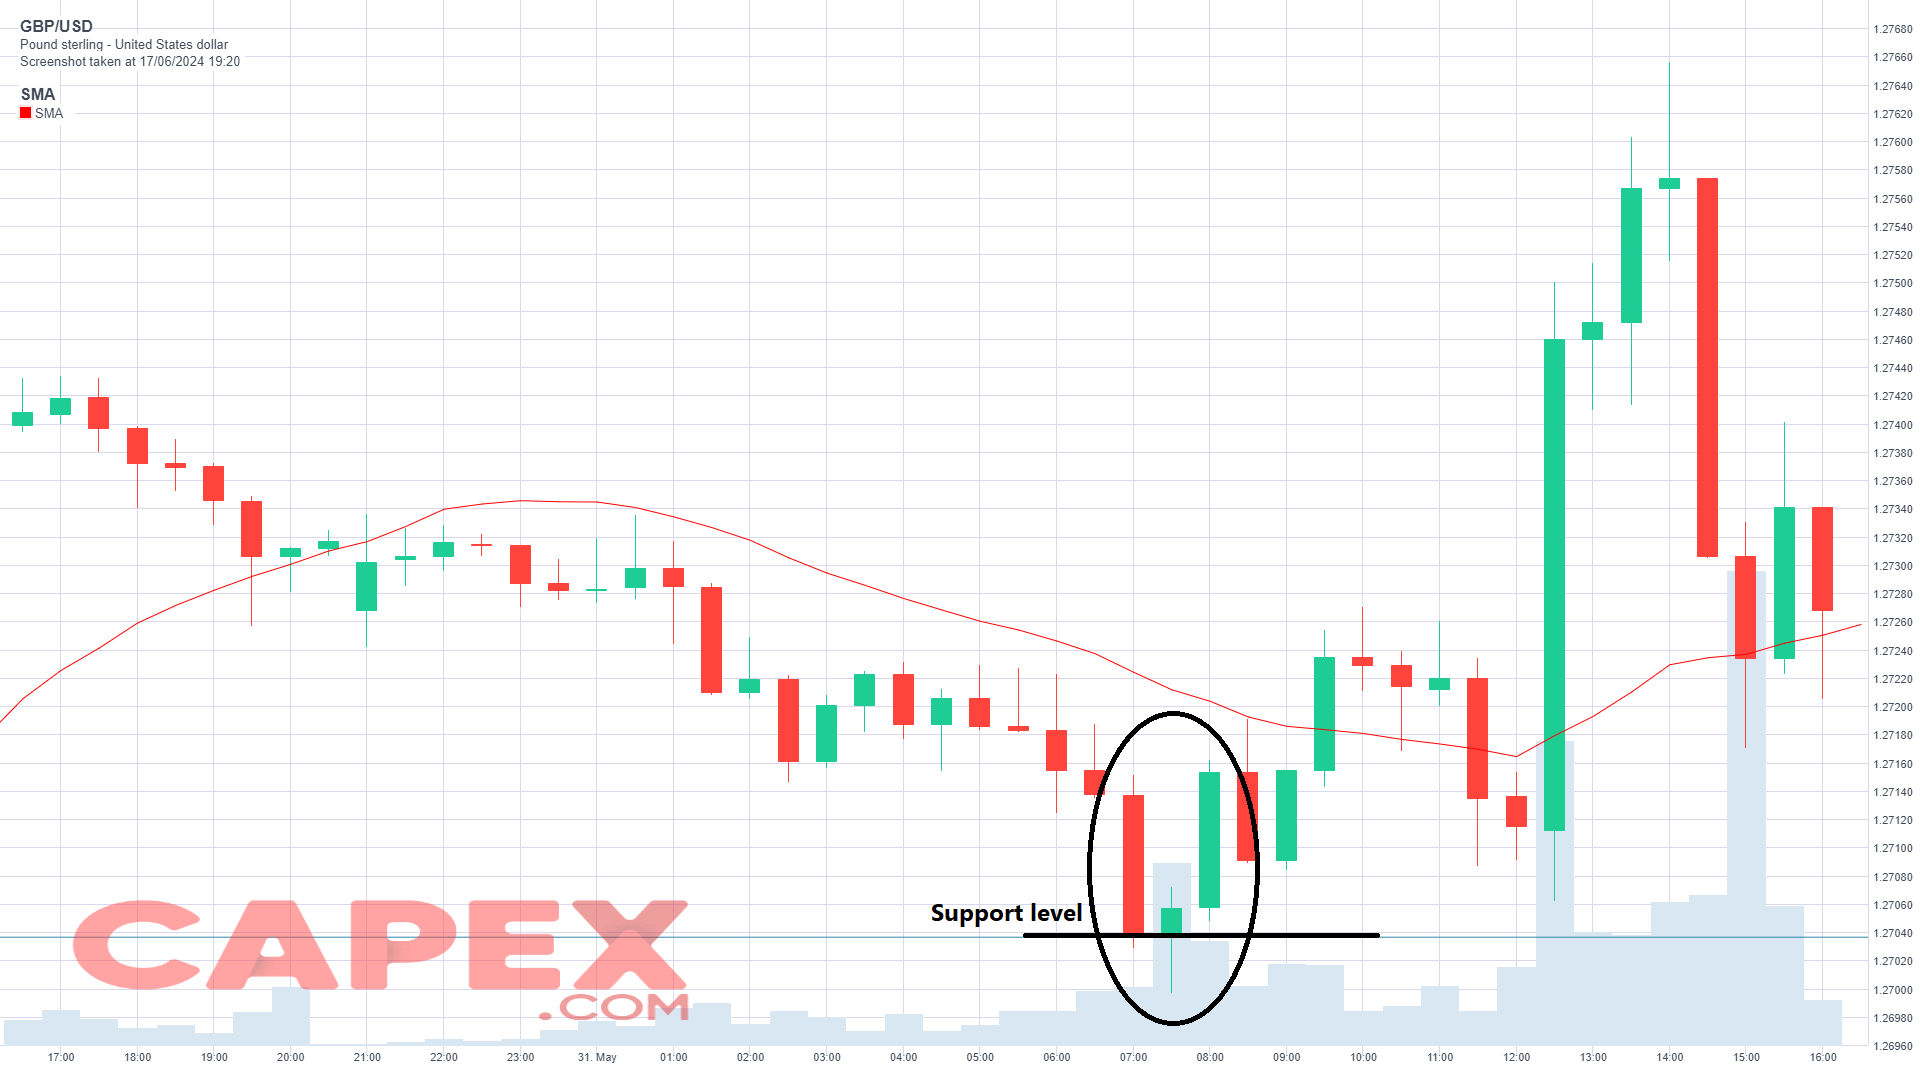
In the GBP/USD chart above, the Morning Star candlestick pattern appears at a support level, indicating a potential reversal to the upside. This pattern is recognized by technical traders as a signal to buy, indicating that market momentum may shift higher from this support barrier.
Trade Morning Star Candlestick Patterns with CAPEX.com
Open a trading account
To get started trading Morning Star candlesticks, open an account. Choose between a live account to trade CFDs straight away or practise first on our demo account with virtual funds.
Choose your financial instrument
Morning Star candlestick patterns can be spotted in most financial markets, especially those that are more volatile, such as forex, cryptocurrencies, and stocks.
Explore ours online trading platform
We offer multiple chart types that are not limited to candlestick charts, as well as a range of order execution tools for fast trading, which in turn helps you to manage risk.
Morning Star Candlestick Pattern Pros and Cons
Since Evening Star candles have advantages and disadvantages, traders should avoid entering a trade immediately after spotting a Morning Star candle. Or unless it is as a trend confirmation signal.
Advantages
- Indicates Possible Trend Reversal: The Morning Star pattern suggests a potential reversal from a downward trend, with a sequence of candles indicating a shift from bearish to bullish sentiment.
- Works in All Time Frames: The Morning Star pattern is effective on various time frames, from intraday to weekly or monthly charts, allowing traders flexibility in their analysis.
- High Probability Setup: The Morning Star is considered a reliable pattern that increases the likelihood of a successful trade, signaling a market shift from selling to buying.
- Clear Entry, Exit, and Stop Levels: The pattern provides clear entry points above the third candle, stop levels below the second candle, and profit targets using standard retracement levels, aiding in risk management.
- Utilizes Trend Confirmation: The accuracy of the Morning Star is enhanced when combined with other trend confirmation methods, such as resistance breaches or oscillators like the RSI, strengthening the reversal signal.
Disadvantages
- Does Not Offer Price Goals: The Morning Star pattern doesn't provide specific upside price targets, requiring traders to use other methods like moving averages or Fibonacci levels to set profit goals.
- Sometimes the Signal Arrives Too Late: Due to its three-candle formation, the Morning Star pattern may trigger after initial upward momentum has passed, leading to late reversal entries.
- Lacks Compelling Entry Signals: Unlike piercing or engulfing patterns, the Morning Star lacks a strong true body candle, reducing conviction for reversal trades.
- Candle Details Can Be Obscured by Shadows: Extended shadows on the first and third candles can obscure the bodies, making it difficult to confirm if a small true body formed on the middle candle as needed, thus decreasing the pattern's reliability.
- Pattern Sometimes Only Leads to Brief Bounce: In strong bearish trends, the Morning Star may result in a brief bounce rather than a full trend reversal. Traders need to be cautious and not misinterpret a temporary bounce as a lasting trend change.
Final notes about Morning Star Candlestick
Understanding the complexities of the Morning Star pattern underscores its significance in technical analysis. This pattern, which indicates potential bullish reversals, stands out in markets often dominated by downtrends.
However, using it effectively requires a careful balance of caution, thorough research, and insightful analysis. Fundamentally, the Morning Star pattern narrates the market's shift from bearish to bullish control. It serves as a vital tool for traders, offering insights into market dynamics.
In conclusion, the Morning Star pattern exemplifies the intricate interplay of market forces. It emphasizes the importance of a perceptive and informed trading approach, where pattern recognition is just one element of a more comprehensive strategy. When skillfully interpreted and integrated, the Morning Star can illuminate paths to potential profits and guide strategic market navigation.
For a robust trading strategy, it is crucial to combine the Morning Star pattern with other technical indicators and effective risk management techniques.
Free resources
Remember, you should have some trading experience and knowledge before you decide to trade with Morning Star candlestick pattern, you should consider using the educational resources we offer like CAPEX Academy or a demo trading account. CAPEX Academy has lots of free trading courses for you to choose from, and they all tackle a different financial concept or process – like the basics of analyses – to help you to become a better trader or make more-informed investment decisions.
Our demo account is a suitable place for you to get an intimate understanding of how trading and investing work – as well as what it’s like to trade with leverage – before risking real capital. For this reason, a demo account with us is a great tool for investors who are looking to make a transition to leveraged securities.
Sources:
- https://candlecharts.com/
- https://www.cfainstitute.org/en/membership/professional-development/refresher-readings/technical-analysis
- https://www.cmegroup.com/education/courses/technical-analysis/chart-types-candlestick-line-bar.html