


We look at the factors affecting the US Technology index and where should traders and investors expect the market to move next, including some of the latest NASDAQ 100 forecasts & price predictions for 2024 and beyond.
Tech stocks took center stage in 2023, with the Nasdaq 100 rising to all-time highs in December. The US Tech 100 index rose over 50% during 2023 and could have an impact on its performance in 2024, at least according to historical data going back to 1986.
Historically, years when the Nasdaq 100 index soared by 40% or more led to continued growth the following year, except for the dot-com bubble burst in 2000. Based on this pattern, if the Nasdaq 100 maintains or increases its 2023 gains, it might see an average rise of 24.1% in 2024 (historical average in such a scenario).
The tech-heavy Nasdaq 100 has outperformed in part due to a recovery in tech equities after the decline we experienced in 2022. The worldwide "artificial intelligence" craze has propelled gains. Relief following the debt ceiling agreement, inflation cooling, and FOMO have also helped the indices push higher.
NASDAQ-100 Forecast & Price Predictions Summary
- Nasdaq-100 forecast today: The “Santa Claus Rally” that Wall Street will have a lot to say about its potential move higher. Short-term pullbacks open the possibility of a move to the upside, with the 16,000-level underneath offering short-term support. Underneath that, the 15,750 level also offers support as well.
- Nasdaq-100 price predictions 2024: While it's unlikely investors will experience a gain as large as 2023, the analysts and data suggest investors can still look forward to an upside of +20% next year (if history repeats).
- Nasdaq-100 forecast for the next 5 years: AI has become the hottest word on Wall Street in 2023 and will remain a megatrend that won’t be going away anytime soon according to experts from IBM. Wallet Investor 's five-year projection showed the index at 20,000, indicating a bullish Nasdaq 100 forecast for 2030 at new all-time highs.
With CAPEX.com you can trade NASDAQ Index directly, trade or invest in NASDAQ 100 ETFs, and trade or invest in NASDAQ 100 components.
Nasdaq-100 forecast 2024, according to historical data
Years in which the NASDAQ-100 has achieved a gain of 40% (or more) are almost always followed by further gains the following year, except for 1999, which preceded the burst of the dot-com bubble:
YEAR NASDAQ-100 GAIN NASDAQ-100 GAIN (LOSS) THE FOLLOWING YEAR 1991 64.9% 8.8% 1995 42.2% 42.2% 1996 42.2% 20.6% 1998 85.3% 101.9% 1999 101.9% (36.8%) 2003 49.1% 10.4% 2009 53.5% 19.2% 2020 47.5% 26.6% 2023 ≈50% ???
According to the NASDAQ-100 forecast based on the above data, there's a possibility it could further rise in 2024 with an average gain of 24.1%.
Of course, history alone shouldn't be the reason investors buy stocks. Several factors could swing the market one way or the other next year, and interest rates might be at the top of that list. Most economists believe the U.S. Federal Reserve has almost done enough to cure the inflation challenges.
Attention will soon turn to interest rate cuts instead, which could begin in Q2 2024, according to current estimates. If that happens, more investors will likely turn to stocks as they hunt for higher returns, and companies will be able to borrow money at cheaper interest rates to fuel growth. Both of those things are tailwinds for the broader market and are highlighted in most of the bullish NASDAQ-100 forecasts and price predictions from big banks and Wall Street analysts.
However, if rates remain higher for longer -- or worse, the Fed increases them more than expected -- the reverse could happen, which will create a headwind for the stock market.
In any case, prior trends support the optimistic NASDAQ-100 price predictions toward the 20,000 level. But the long-term picture is even more exciting because big tech companies continue to work on innovative new technologies like Generative AI.
NASDAQ-100 forecast 2024, according to experts
Analysts optimistically forecast the NASDAQ-100 will end 2024 somewhere between 17,000 and 18,500. They are not alone in his rosy outlook.
Bank of America and Deutsche Bank forecast the NASDAQ-100 will increase to 5,000 or higher. Goldman Sachs Group believes the stock benchmark will end at or near its prior record, and Morgan Stanley's Mike Wilson, typically known for holding a bearish view on stocks, is forecasting the NASDAQ-100 index will close 2024 at around 16,000 points.
BMO Capital Market also forecasts the NASDAQ-100 to climb to a record in 2024, while Societe Generale is looking for equities to edge higher, even if they don't topple the prior closing peak hit in January 2022.
Amid these bullish NASDAQ-100 price predictions, JPMorgan Chase is the biggest outlier forecasting the NASDAQ-100 will decline at least 10% by the end of 2024 as household savings contract and geopolitical risks stay elevated.
JPMorgan analysts highlight that virtually all of the stock market's gains this year came from a small number of tech stocks, while the rest of the market was largely in a 'holding pattern,' unsure of prospects for the economy. This led to a high concentration of index weight in a handful of the largest stocks, something not seen in 50 years, explained the bank's analysts.
Bank of America: bullish NASDAQ-100 forecast
Because of the Federal Reserve's significant success in tightening its monetary policy after more than a year of aggressive interest rate hikes and the continuous shrinking of its balance sheet, Bank of America is bullish on the stock market in 2024.
"We're bullish not because we expect the Fed to cut, but because of what the Fed has accomplished. Companies have adapted to higher rates and inflation."
It also helps that investors continue to focus on the possibility of an economic recession and are paying greater attention to negative than positive news.
"We are past maximum macro uncertainty. The market has absorbed significant geopolitical shocks already and the good news is we're talking about the bad news."
Deutsche Bank: bullish NASDAQ-100 price forecast
According to Deutsche Bank's 2024 stock market outlook, the US economy is approaching a soft landing as inflation cools and GDP growth remains solid, and that's a great scenario for the stock market.
"Even if an economic recession does materialize in 2024, it shouldn't impact stock prices dramatically because most investors are anticipating it."
The bank forecast NASDAQ to rise around 10% in 2024, and if the economy dodges a recession, the gains could nearly double to about 19% in its bull-case scenario.
JPMorgan: bearish stock market, with bullish NASDAQ-100 forecast
JPMorgan said high equity valuations, high-interest rates, a weakening consumer, rising geopolitical risks, and a potential recession give it little confidence that stocks will move higher in 2024.
"We expect a more challenging macro backdrop for stocks next year with softening consumer trends at a time when investor positioning and sentiment have mostly reversed."
The bank's stock market forecast for 2024 is explained by lackluster global earnings growth with a downside for equities from current levels.
"Equities are now richly valued with volatility near the historical low, while geopolitical and political risks remain elevated."
However, the outlook for internet stocks and the NASDAQ-100 forecast is bullish in 2024, as mega-cap tech names should continue to lead the way as they have throughout 2023:
"We anticipate our coverage universe [internet companies] will broadly re-accelerate revenue growth to more normalized levels, including mega-caps (3 of the Mag 7) returning to low double-digit percent year-over-year growth."
Morgan Stanley: neutral NASDAQ-100 price prediction
Morgan Stanley anticipates a flat stock market in 2024 but notes that certain regions of the market are outperforming others. The corporation predicts that the highly narrow leadership of the mega-cap tech stocks will hold through the beginning of 2019 before eventually collapsing.
"The question for investors at this stage is whether the leaders can drag the laggards up to their level of performance or if the laggards will eventually overwhelm the leaders' ability to keep delivering in this challenging macro environment."
Morgan Stanley recommended investors avoid the high-priced tech stocks and instead focus on defensive growth stocks, typically found in the healthcare, utilities, and consumer staples sectors, as well as late-cycle cyclical stocks typically found in the industrials and energy sectors. Their NASDAQ-100 forecast for 2024 is in line with the actual prices, although slightly bearish.
Goldman Sachs: neutral NASDAQ-100 price forecast
Goldman Sachs forecast the NASDAQ-100 as well as the Dow Jones and S&P 500 to finish 2024 slightly higher from current levels as stocks are stuck in a "fat and flat" range since 2022.
"As higher-for-longer interest rates make valuation expansion from here difficult to justify, our market forecasts are broadly in line with earnings growth. On a weighted basis, we expect 8% price returns and 10% total returns for Global equities over the next year, taking them towards the upper end of the Fat & Flat range that they have been in since 2022."
Corporate earnings should also remain solid next year, providing a buoy to stock prices, as long as a recession is averted.
"In the absence of recession, corporate earnings rarely fall. Nevertheless, the lack of strong profit growth and a high starting valuation (particularly in the US equity market), and low equity risk premia leaves an unexciting outlook overall on a risk-adjusted basis, relative to cash returns."
Societe Generale: neutral NASDAQ-100 price forecast
The indices should be in ‘buy-the-dip’ territory, as leading indicators for profits continue to improve. Yet, the journey to the end of the year should be far from smooth, as the bank expects a mild recession in the middle of the year, a credit market sell-off in 2Q, and ongoing quantitative tightening.
"In the US, the long-predicted recession will in our view belatedly materialize in 2024, most likely during the middle quarters of the year, though it stands to be brief and shallow."
Wells Fargo: neutral NASDAQ-100 price forecast
With the VIX low, credit spreads tight, equities rallying, and the cost of capital higher/volatile, it's time to downshift. The bank expects a volatile and ultimately flattish NASDAQ-100 price prediction in 2024, as valuation limits upside and rate uncertainty elevates downside risk.
"There already are some cracks that are beginning to appear in the economy, and these strains likely will intensify in the coming months as monetary restraint remains in place. Our base case is that real GDP will contract modestly starting in mid-2024."
NASDAQ-100 Forecast - Will the Big Tech stocks maintain their momentum in 2024?
Despite the impressive performance in 2023, the Big Seven (Apple, Tesla, Amazon, Alphabet, Nvidia, META, and Microsoft) could be challenged by sizable risks in 2024. Some analysts tell investors to be aware that 'Magnificent Seven' is starting to resemble 'Nifty 50' stocks that got crushed in the 1970s market crash.
However, JP Morgan called Alphabet and Amazon "top picks" in its 2024 outlook for internet companies. The bank's bullish calls on the two companies are bets that the rally in mega-cap tech stocks will continue next year.
NVIDIA
New US chip restrictions placed on China may cause NVIDIA to experience significant losses in data center revenue in the fourth quarter of 2023. According to the company's third-quarter financial report, data center products accounted for roughly 80% of its revenue, with 25% of that amount coming from sales in China.
The degree to which these rules will have an impact is yet unknown, although management's assertions that NVIDIA's sales growth in other markets will counteract the drop in China. In addition, early in September, when the price of the stock was approximately US$500, NVIDIA CEO Jensen Huang sold his shares.
TESLA
Tesla's stock price surged to about $300 in July, but it has since fallen, mostly because of a decline in delivery quantities that was noted in the third quarter. Early in 2024, Q4 profits were revealed, and these will continue to show where Tesla might go in that year.
Elon Musk, the CEO of Tesla, claims that the company will meet its 1.8 million vehicle delivery goal by 2023. However, price reductions, which have reduced the gross margin, were the primary driver of its quick growth in the first three quarters. Tesla needs to deliver more than 470,000 vehicles in the fourth quarter—more than it did in any of the previous three quarters—to meet the 1.8 million vehicle target.
MICROSOFT
The stock of Microsoft reached all-time highs in 2023. The corporation is continuing to integrate artificial intelligence (AI) into every product in its lineup, making this one of the most revolutionary years in its history. With a $10 billion investment in ChatGPT developer OpenAI, Microsoft launched 2023, the technology is integrated into the Edge web browser, the Bing search engine, the Windows operating system, the 365-document suite, and the Azure cloud platform.
With over 18,000 commercial clients now able to utilize OpenAI's most recent GPT-4 model on Azure to create their own AI applications, it's one of the very few organizations that is already making money off AI. However, this is only the start. Microsoft will further set itself apart from its cloud rivals next year when it makes its innovative AI data center processors available to Azure users.
AMAZON
Amazon faces slowing increases due to a drop in excess savings among US consumers and challenges in student loan repayments. AMZN stock has the most upside of the mega-cap tech companies, according to JPMorgan. The bank set a $190 price target for the e-commerce giant, representing a potential upside of +30% from current levels.
JPMorgan expects Amazon to grow its total revenue by 13% from 2023 levels, supported by a jump in growth for the company's Amazon Web Services and retail divisions. The bank estimates retail revenue growth will jump by 11% in 2024, compared to growth of 9% in 2023, driven by increased same-day delivery, growth in third-party fulfillment, and pricing power.
ALPHABET
Google's cloud business has already shown signs of faltering growth. However, Alphabet stock is a new top pick for JPMorgan thanks to the company's "improving ad growth, bigger margin gains, and Gemini tightening the Gen AI gap."
The bank said it expects Alphabet's gross revenue to grow 11% in 2024, driven mostly by its Google Cloud division and YouTube ads. Alphabet's artificial intelligence initiatives should also help the company stand out as an AI-forward company.
META
Although CEO Mark Zuckerberg expressed satisfaction with the company's AI work, he stated that it is too soon to discuss monetization, making AI the newest technology to steal money rather than create it. Nevertheless, Meta is optimistic that AI will completely transform its social media industry. It is relying on AI to change well-liked apps that haven't been adequately monetized, like its messaging services.
According to Meta, the company is attempting to use AI in a different way than other businesses, such as OpenAI's ChatGPT, therefore it is even more experimental. Meta shares are trading lower in the wake of the results as investors worry that the advertising market may not rebound as hoped in 2024. However, analysts forecast the NASDAQ-100 top component has around 20% upside potential from current levels.
APPLE
Although Apple's quarterly earnings reports have exceeded forecasts, the APPL stock price has only slightly increased this year. When it comes to discussing any advancements in AI, it is still quite quiet in comparison to the other Big Seven.
Apple's services segment, which includes subscriptions like iCloud, increased 16% YoY, despite the company still facing direct competition in the mobile industry.
How to trade Big Tech stocks
You can trade Big Tech stocks and the Nasdaq 100 with CAPEX.com in just four easy steps:
- Open a Trade account, or log in if you’re already a customer.
- Search for the stock or index you want in our award-winning platform
- Choose your position and size, and your stop and limit levels
- Place the trade
- Or you can practice trading risk-free by signing up for our Demo Trading Account.
NASDAQ 100 Forecast - AI Stocks in 2024
We can’t forecast NASDAQ-100 and Big Tech without discussing artificial intelligence. The breakthrough technology has become the hottest thing on Wall Street and, unlike the hype that we have seen over recent years about everything from the metaverse to NFTs, AI appears to have real-world solutions that are deployed today.
The AI-mania has provided a much-needed boost to the tech market as inflation, rising interest rates, and recessionary risks provide a challenging economic backdrop. But there are questions about whether it will progress quickly enough to fully counter the impact of the lagging effects of monetary policy as we move into the second half. What is the outlook for AI stocks in 2024 and how this megatrend impacts the Nasdaq-100 forecasts and price predictions?
Is there an AI bubble?
Even though the race for AI dominance has barely begun, concerns about whether AI is the next bubble are already being raised in the markets, which are still reeling from the 2000 dot com catastrophe.
Although some individual stocks have sky-high valuations thanks to AI, overall, we are still far from the extremes of the dot com bubble. For instance, right before the dot com bubble burst in 2000, the tech-heavy Nasdaq 100 was trading 175 times ahead of trailing earnings. The current value is 33x, which is less than the 10-year average.
Based on projected earnings for the following 12 months, the ratio as of right now is even lower, at 28x. That implies two important ideas. First off, investors haven't flocked into the next great thing too quickly as they have in the past, and expectations are still moderate. Second, it implies that despite companies' and investors' efforts to establish themselves in this brand-new, rapidly evolving field, AI has not yet led to an improvement in earnings projections in the broader market.
Markets should be particularly vigilant on valuation considering this. There will undoubtedly be more companies thrust into the AI spotlight and driven higher as they find new use cases, especially financially rewarding ones. Some of the earliest beneficiaries will see their premium valuations tested and are at risk of seeing these fall away if they fail to live up to the hype.
What development in AI could benefit first in 2024?
Generative AI (genAI) has commanded attention and moved markets this year, earning comparisons to the internet and smartphone for its transformative potential. Experts forecast genAI is also setting up to be a key contributor to market dispersion, as it has the potential to send some businesses soaring while disrupting or displacing others.
Investing in genAI is a very active endeavor since one must be agile and aware of the opportunities at each given point in the process. An examination of the technology "stack" reveals available and future options, all of which are subject to change as genAI develops, becomes more intelligent, and becomes sharper.
What it is Where to invest Infrastructure & Cloud The hardware and computing resources needed to enable AI function and growth. Includes GPUs, storage, and memory. Cloud service providers building AI-enabled data centers; semiconductors and makers of chip manufacturing equipment are critical inputs. AI models (proprietary & open source) The software required to train AI to “think” and do. Companies involved in the research and development of AI learning and language models. Data (private & public/free) The information upon which AI models will “think,” process and generate content. Suppliers of information and analytics, and those involved in data staging. AI makes private data more useful and, therefore, more valuable. Tools & applications The tools to create apps and the actual instruments and apps powered by generative AI. Companies that build apps and the tools to create them. Existing apps will be enhanced; many start-ups likely to emerge.
Like the internet over the last 25 years, generative AI is seen to be improving and has the potential to revolutionize enterprises globally. However, we cannot approach the investing thesis in a static manner because genAI is novel, fascinating, and constantly changing. As generative AI progresses from peak expectations to enlightenment and productivity, fundamental-based stock pickers should constantly verify the investment case. Experts anticipate that the genAI tale will continue to be written for many years to come and further support the bullish NASDAQ-100 forecast and price predictions for 2024 and beyond.
NASDAQ 100 Forecast - Key Drivers to Watch
Some of the specific themes Wall Street analysts see playing a critical role in 2024 and beyond include:
Leading through macroeconomic uncertainty
The C-suites of many internet companies are under pressure to raise margins and boost revenues as a result of declining market capitalizations, declining consumer spending, and decreased product demand.
Beyond personnel changes, strategies can include streamlining company procedures, relying more on intelligent automation, updating outdated infrastructures, and taking strategic mergers and acquisitions into account.Adapting to new regulations
The operations of internet corporations are becoming increasingly impacted by social issues and climate change. Governments and shareholders all around the world are pressuring businesses to be more transparent about their environmental impacts and tax obligations. Updates to company management software solutions are anticipated to be necessary as a result of new and planned rules. This will allow businesses to attain real-time visibility and offer authorities access to the data they will need for increasingly complex compliance processes.
Navigating global uncertainties
As technology companies confront heightened global challenges, they should work to mitigate risks and build more resilient systems. Leaders should think strategically about their choices of partners, where they’re located, and where and how production takes place.
Transforming other industries through technology
Technology companies should try to reduce risks and create more resilient systems as they face more severe global challenges. Leaders should consider their partner selections, their locations, and the location and mode of production strategically.
NASDAQ-100 forecast 2024, according to technical chart analysis
NASDAQ-100 is testing the January 2022 levels after a 7-week rally that brought a new record high.
Nasdaq-100 Index is in a rising trend channel in the medium and long term. Rising trends indicate that the market is experiencing positive development and that buy interest among investors is increasing. There is no resistance in the price chart and further rise is indicated.

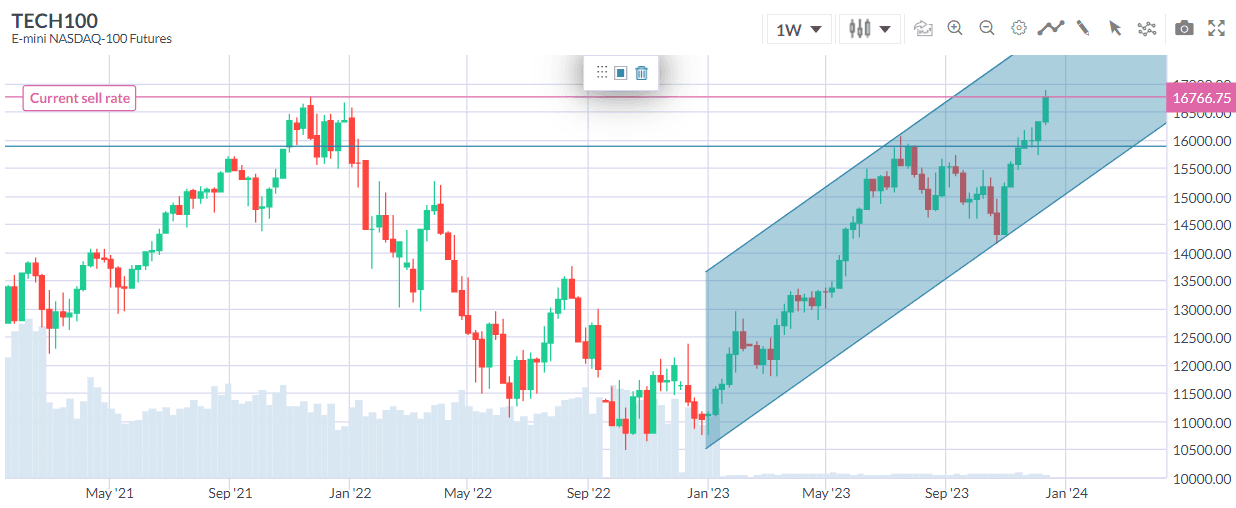
In case of a negative reaction, the index has support at approximately 15900 points. RSI is above 70 after a good price increase in the past weeks. The index has strong positive momentum and further increase is indicated. However, particularly for big stocks, a high RSI may be a sign that the stock is overbought and that there is a chance of a reaction downwards. The index is overall assessed as technically positive for the medium-long term.
With the NASDAQ-100 breaking to new all-time highs, we look at the next correction to evaluate the strength of the trend. Though, there are 3 potential scenarios:
- A weak correction above the previous swing high, basically leaving a space between the low and the Jan 2022 high (16,800), indicates that buyers have overwhelmed sellers or simply that sellers are disinterested. This is a positive sign for the underlying trend and supports the most bullish NASDAQ-100 forecasts and price predictions.
- An intermediate trend counter trend below the previous swing high (16,800 on Jan 2022), indicates that the underlying trend is struggling. This should look like a rising wedge or ending diagonal and should be resolved with an exhaustion move-up (final leg) or a break of the key support levels and further sell-offs. This type of trend pattern supports the neutral NASDAQ-100 forecasts and price predictions as the struggling move should continue for a few months.
- A reversal movement after new highs is bearish and signals a fake breakout of the Jan 2022 highs. Such a development should lead to strong sell-offs within the start of 2024 and support the bearish NASDAQ-100 price predictions.
Nasdaq-100 Price Predictions for 2024 (AI-based)
The Nasdaq 100 forecast for 2024 from algorithm-based forecasting service Wallet Investor at the time of writing indicated that the index could open 2024 at 16,275.
The service’s Nasdaq 100 forecast for 2024 estimated that the index could climb to a maximum of 16,667, and end the year at 16,387. Wallet Investor’s five-year projection showed the index at 17,063, indicating a bullish Nasdaq 100 forecast for 2030 at new all-time highs.
The Nasdaq 100 price prediction from Long Forecast Agency is bullish, predicting that the index could open 2024 at 17,149 and trade above 20,000 points during 2024. The NASDAQ 5-year forecast is also bullish, with the Tech index expected to trade as high as 25,000 points.
A US100 forecast from Trading Economics estimated that the index could be priced at 16558 by the end of this quarter and at 16459 in one year.
The NASDAQ 100 Futures forecast from Gov Capital is the most bullish, with prices expected to trade above 20,000 points at the end of 2024. The NASDAQ 100 5-year forecast is also bullish, with price predictions above 40,000 points.
Nasdaq-100 Price Predictions by Components (Top 10)
NASDAQ-100 price predictions are based on its components' price predictions which we'll review below. The list includes 10 components sorted by each component's weight in the index.
Microsoft Corp (13.25%)
The 41 analysts offering 12-month price forecasts for Nasdaq 100 component Microsoft Corp have a median target of 415, with a high estimate of 600 and a low estimate of 330. The median estimate represents a +13% increase from the opening prices of 2024.
The current consensus among 49 polled investment analysts is to buy stock in Microsoft Corp. This rating has held steady since April, when it was unchanged from a buy rating.Apple Inc (12.51%)
The 37 analysts offering 12-month price forecasts for Nasdaq 100 component Apple Inc have a median target of 200, with a high estimate of 240.00 and a low estimate of 125. The median estimate represents a +14% increase from the opening prices of 2024.
The current consensus among 41 polled investment analysts is to buy stock in Apple Inc. This rating has held steady since April, when it was unchanged from a buy rating.Amazon (6.69%)
The 54 analysts offering 12-month price forecasts for Nasdaq 100 component Amazon have a median target of 175, with a high estimate of 230 and a low estimate of 136. The median estimate represents a +18% increase from the opening prices of 2024.
The current consensus among 54 polled investment analysts is to buy stock in Amazon.com Inc. This rating has held steady since April, when it was unchanged from a buy rating.Nvidia (5.62%)
The 40 analysts offering 12-month price forecasts for Nasdaq 100 component NVIDIA Corp have a median target of 645, with a high estimate of 1100 and a low estimate of 560. The median estimate represents a +33% increase from the opening prices of 2024.
The current consensus among 46 polled investment analysts is to buy stock in NVIDIA Corp. This rating has held steady since April, when it was unchanged from a buy rating.Alphabet (4.13%)
The 46 analysts offering 12-month price forecasts for Nasdaq 100 component Alphabet Inc have a median target of 155, with a high estimate of 80 and a low estimate of 126. The median estimate represents a +16% increase from the opening prices of 2024.
The current consensus among 51 polled investment analysts is to buy stock in Alphabet Inc. This rating has held steady since April, when it was unchanged from a buy rating.META (3.98%)
The 51 analysts offering 12-month price forecasts for Nasdaq 100 component Meta Platforms Inc have a median target of 382, with a high estimate of 477 and a low estimate of 175. The median estimate represents a 14% increase from the opening prices of 2024.
The current consensus among 59 polled investment analysts is to buy stock in Meta Platforms Inc. This rating has held steady since April, when it was unchanged from a buy rating.Tesla (3.20%)
The 35 analysts offering 12-month price forecasts for Nasdaq 100 component Tesla Inc have a median target of 256, with a high estimate of 380 and a low estimate of 53. The median estimate represents a +2% decrease from the opening prices of 2024.
The current consensus among 47 polled investment analysts is to hold stock in Tesla Inc. This rating has held steady since April, when it was unchanged from a hold rating.Broadcom Inc (2.07%)
The 22 analysts offering 12-month price forecasts for Nasdaq 100 component Broadcom Inc have a median target of 1087, with a high estimate of 1050.00 and a low estimate of 900. The median estimate represents a 1% decrease from opening prices of 2024.
The current consensus among 27 polled investment analysts is to buy stock in Broadcom Inc. This rating has held steady since April, when it was unchanged from a buy rating.Pepsico (1.92%)
The 17 analysts offering 12-month price forecasts for Nasdaq 100 component PepsiCo Inc have a median target of 187, with a high estimate of 236 and a low estimate of 131. The median estimate represents a +10% increase from the opening prices of 2024.
The current consensus among 23 polled investment analysts is to hold stock in PepsiCo Inc. This rating has held steady since April, when it was unchanged from a hold rating.Costco (1.60%)
The 17 analysts offering 12-month price forecasts for Nasdaq 100 component Costco Wholesale Corp have a median target of 660, with a high estimate of 725 and a low estimate of 502. The median estimate represents a +5% increase from the opening prices of 2024.
The current consensus among 35 polled investment analysts is to buy stock in Costco Wholesale Corp. This rating has held steady since April, when it was unchanged from a buy rating.
*It is worth keeping in mind that both analysts and online forecasting sites can and do get their predictions wrong. Keep in mind that past performance and forecasts are not reliable indicators of future returns. When considering Nasdaq 100 price predictions for 2023 and beyond, it’s important to keep in mind that high market volatility and the macroeconomic environment make it difficult to produce accurate long-term Nasdaq 100 analyses and estimates. As such, analysts and forecasters can get their Nasdaq 100 forecast wrong.
It is essential to do your research and always remember your decision to trade depends on your attitude to risk, your expertise in the market, the spread of your investment portfolio, and how comfortable you feel about losing money. You should never invest money that you cannot afford to lose.
How can you trade or invest in the NASDAQ 100?
With CAPEX.com, there are a number of ways to gain exposure to the NASDAQ 100 (known on our platform as the US Tech 100) – so you can choose the one that suits you best.
Trade the NASDAQ 100 index directly
With CAPEX.com you can trade E-mini NASDAQ-100 Futures Sun-Fri: 23:01-21:10 with tight spreads starting from 1 point
and leverage as high as 1:20.Trade or invest in NASDAQ-100 ETFs
With CAPEX.com you can trade the largest NASDAQ-100 Index ETF (Invesco), inverse and leveraged ETFs, tech and robotics ETFs, cybersecurity ETFs or AI ETFs.
Trade or invest in NASDAQ-100 stocks
With CAPEX.com you can buy tech stocks outright or you can trade on their price movements without having to take ownership of shares, through CFDs.
Trade the NASDAQ 100 index directly
Trade the performance of the USA’s largest domestic and international companies from a single position. You can trade the NASDAQ 100’s price directly on the CAPEX.com platform under the name ‘US Tech 100’. In other words, you’ll get direct exposure to the NASDAQ 100 index with us. It’s more liquid than trading it in other ways and you can trade it 24 hours a day, Monday to Friday.
You can trade the NASDAQ 100 on leverage using CFDs, without having to own any actual shares. Instead, you’ll put down a deposit to open a larger position, with profits and losses calculated on the full position size. This means your profits and losses can significantly outweigh your margin amount, so ensure you use risk management tools (like stop losses) when trading online.
You can go ‘long’ if you think the price will rise or ‘short’ if you think the price will fall.
Trade or invest in NASDAQ 100 ETFs
Gain broad exposure to the entire NASDAQ 100 by trading or investing in an ETF that tracks the price of the index. This means you won’t trade on the current price of the NASDAQ, but rather the ETF’s price, calculated on its net asset value (NAV).
Investing in NASDAQ ETFs is how many longer-term investors get exposure to the entire index. You can do this with share dealing. Here, you’d buy upfront, based on the full value of the ETF, and hold until you want to sell.
You could also trade NASDAQ ETFs on leverage with CFDs, but bear in mind this offers lower liquidity and higher spreads than trading the index directly. Leveraged trades mean you can go long or short on NASDAQ ETFs. However, total profits or losses can significantly outweigh your margin amount, as both are based on the total position size.
With CAPEX.com you can trade the largest NASDAQ-100 Index ETF (Invesco), but also Inverse ETFs (ProShares Ultra Short) and Leveraged ETFs (ProShares Ultra), Tech and Robotics ETFs, Cybersecurity ETFs, or AI ETFs.
Trade or invest in NASDAQ shares
With CAPEX.com, you can also trade or invest in the actual stocks included in the NASDAQ 100.
Target specific NASDAQ 100 stocks like META (Facebook), Tesla, or Alphabet, without gaining exposure to the entire index. With this option, you choose your own NASDAQ shares based on your personal trading strategy.
Invest in stocks with zero commission charges (terms apply) on our investment platform and own actual NASDAQ 100 company shares outright.
You can also trade NASDAQ companies without having to take ownership of shares, using CFDs. Stock trading is leveraged, so you can go long or short.
Read also our monthly updates on fx, commodity and stock market:
- Euro to Dollar forecast and price prediction 2024
- Pound to Dollar forecast and price prediction 2024
- USD to INR forecast 2024, 2025, 2030
- AED to INR forecast 2024, 2025, 2030
- SAR to INR forecast 2024, 2025, 2030
- Gold forecast and price prediction 2024
- Oil forecast and price prediction 2024
- Dow Jones forecast and price prediction 2024
- Nasdaq-100 forecast and price prediction 2024
- Natural Gas forecast and price prediction 2024
- Silver forecast and price prediction 2024